A Funnel chart is often used to represent a sales pipeline or anything of decreeing size. Like pie charts, their total area represents 100%. Being such a popular chart used to visually explain data, it’s a surprise that funnel charts were not introduced to Excel until 2016.
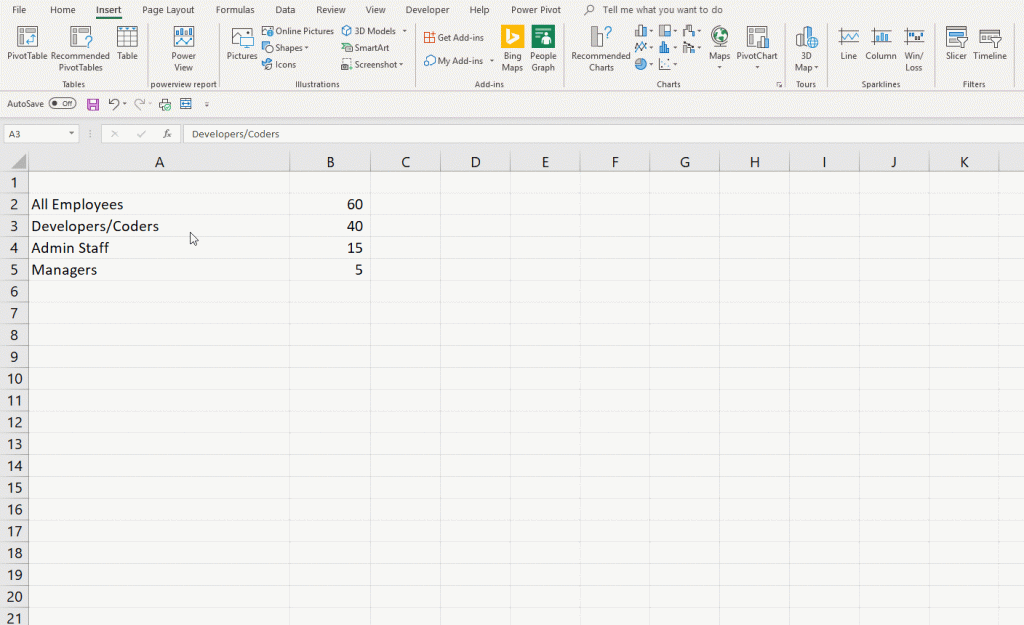
To create a Funnel Chart in Excel, your data must first be set up correctly. As a funnel chart displays values of decreasing order, the data for the chart should be structured in the same way.

You will need two columns of data for a funnel chart. The first column will include your labels or stages in the process. The second column will include the values. It is important these values are shown in descending order.

To insert a funnel chart in Excel, select the data and from the Insert Ribbon select Recommended charts. The funnel chart is the 4th chart down. Press ok and a funnel chart will be displayed in your worksheet

You can also insert a funnel chart using chart commands on the Insert ribbon. To insert a Funnel chart, select the data, or just place the active key within the data. Then, from the insert ribbon select waterfall charts. The Funnel chart is the second chart down.

As with all charts in Excel, once you insert the chart, a design and format ribbon will become available. These are the same ribbons you would be familiar with from using other charts.
The design ribbon gives you options for adding chart elements and quickly changing the layout and styles of the chart. It is also possible from this ribbon to change the chart type.

The format ribbon allows you to make changes to the format of the chart, such as changing the text colors and effect.

Take A FREE course with us Today!

The Ultimate Excel Formulas Course
* includes XLOOKUP and will soon include Dynamic Arrays

Become a Power Pivot Hero

GET and TRANSFORM DATA like a PRO
Power Query Excel 365

Learn DAX for Power Pivot and Power BI

Best Value Excel and Excel Power Tool Learning. Access All Areas, Unlimited Learning Subscription

Learn and Earn Activity
It is becoming more and more common to display data using visualizations, funnel charts being a fantastic option for certain data types. In your organization where could you apply funnel charts instead of a table of data?
Answer the question below in the comments and you may be rewarded with STEEM Tokens.
What are Excel Learn and Earn Activities - Find out more now
Sign up for my newsletter – Don’t worry, I won’t spam. Just useful Excel and Power BI tips and tricks to your inbox
Cross posted from my blog with SteemPress : http://theexcelclub.com/funnel-charts-in-excel/
Learn and Earn Activity:
In your organization where could you apply funnel charts instead of a table of data?
I will use it when i will analyze the number of patients cured in each department as I am in health sector employ
- Zain ul Abideen
I can visualize seeing some uses to this at work! No wonder I haven’t seen it yet, Excel needs to be upgraded for me.
Posted using Partiko iOS
oh you should upgrade, the newer versions have so much more functionality. What version are you on?
Learn and earn activity 2: in the organization funnel charts can be applied in sales & marketing, recruitment dept
- muftie
Learn and Earn Activity:
In your organization where could you apply funnel charts instead of a table of data?
In my organization, funnel chart can be used to represent the sales processes and to identify the potential problems in those sales processes.
- Sareeta
Learn and Earn Activity:
I see several instances where I can apply this, mostly it would be to highlight the most used categories, or revenue per such.
Learn and Earn Activity:
In your organization where could you apply funnel charts instead of a table of data?
In my organization, funnel charts are very suitable for Sales & Marketing department. It is because it's connected with sales.
Learn and earn activity: funnel chart can be used to show the different stages of a sales process and for every stage the number of revenue it has in it's potential.
- Kenroy Hunter
Learn and Earn Activity:
In your organization where could you apply funnel charts instead of a table of data?
Can be used to show the different levels of a sales process and for every level the number of potential earnings.
Hi there all,
Well although there are many other graphib¡cs that could be used, I do find that the Funnel charts are great for using with students as they are a very simple and visual way to moniter exam results in Team Quizzes. The teams compete to reach the top of the chart , so it's a simple use for it.
Learn and Earn Activity: A funnel chart can be used in an organization to to find potential threats in the area of sales processes.
- Kenroy Hunter