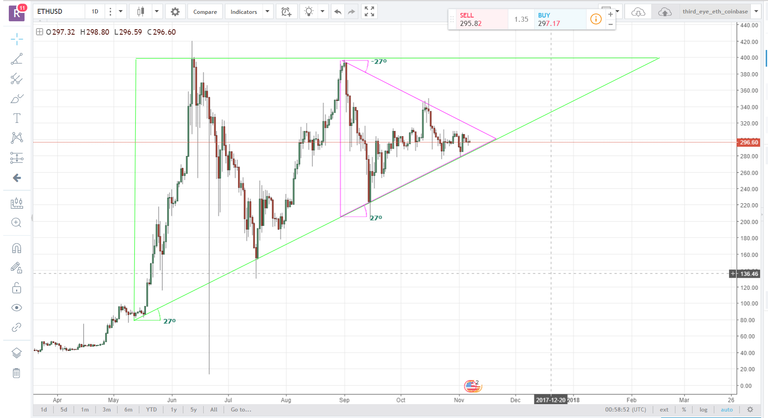
I use classical charting principles to identify good risk/reward setups. I've been patiently watching the large ascending triangle formation in Ethereum that dates to May of this year.
Inside the large ascending triangle, a symmetrical triangle has also formed at a 27 degree angle, shown in pink below.
What to watch for:
We want to see ETH first break above the symmetrical triangle upper boundary (downward sloping pink line). This will trigger a buy signal. Set a stop loss below the upward sloping pink/green line on a daily close which would invalidate the pattern.
If ETH breaks to the upside of the symmetrical triangle (downward sloping pink line), the first price target is the all-time high at $400/ETH. You want to close 50% of your position here with a profit of about 33% from today's price of $300/ETH.
Once the first price target is achieved, the larger ascending triangle pattern is in play. A breakout is confirmed if ETH breaks above $400/ETH on a daily close above the horizontal boundary of the ascending triangle (horizontal green line). This targets a price of ~$660/ETH. You want to close the other 50% of your position between $600 - $660 for a profit of > 100% from today's price of ~$300/ETH.
A daily close below $280/ETH as of today or anywhere below the upward sloping green line hereafter invalidates the pattern and signals you should take the position off at a small loss. So you are risking a maximum loss of ~6% for 100% upside. Not a bad risk/reward.
The symmetrical triangle and ascending triangle patterns are two of the most reliable patterns in technical analysis.
Disclaimer: nothing here is trading advice, trade at your own risk. Good luck fellow Steemers!