
SUMMARY
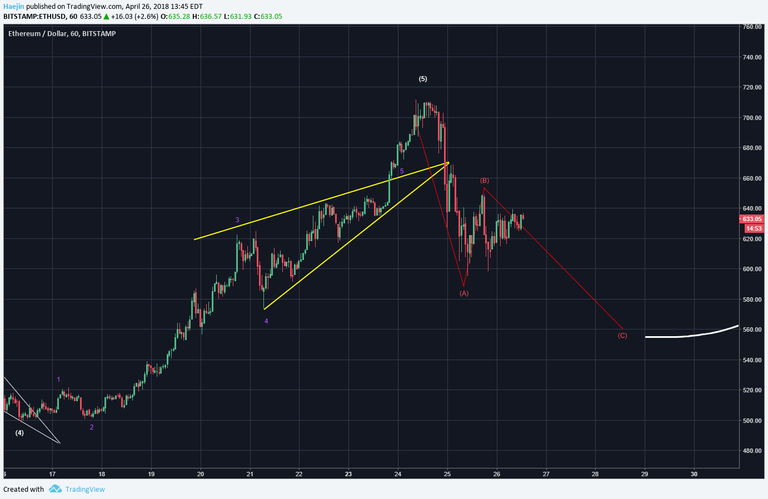
Ethereum (ETH) is correcting after putting in five waves. There are 34 possible corrective combinations at every turn in price. This is why corrections are not traded but monitored and analyzed for the terminal end to cast an entry ladder. The below chart maintains an ABC ZigZag (5,3,5) type as the primary.
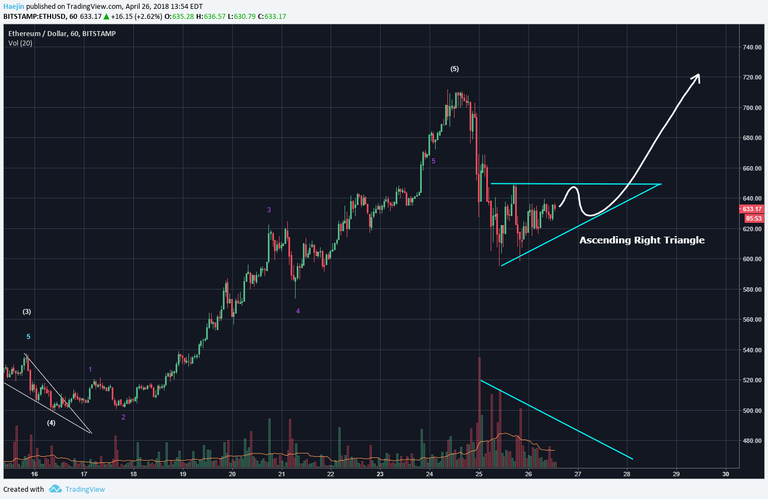
Purely from a forward discernment perspective, the below chart lays out the probable price pathway for an ascending right triangle formation. The decline in volume also confirms, thus far. IF this is correct, the price would traverse similar to the white arrow line until it can breach up and above the upper horizontal trendline.
Legal Disclaimer: I am not a financial advisor nor is any content in this article presented as financial advice. The information provided in this blog post and any other posts that I make and any accompanying material is for informational purposes only. It should not be considered financial or investment advice of any kind. One should consult with a financial or investment professional to determine what may be best for your individual needs. Plain English: This is only my opinion, make of it what you wish. What does this mean? It means it's not advice nor recommendation to either buy or sell anything! It's only meant for use as informative or entertainment purposes.
Please consider reviewing these Tutorials on:
Elliott Wave Counting Tutorial #1
Elliott Wave Counting Tutorial #2
Elliott Wave Counting Tutorial #3
Laddering and Buy/Sell Setups.
Laddering Example with EOS
Tutorial on the use of Fibonacci & Elliott Waves
@haejin's Trading Nuggets
Essay: Is Technical Analysis a Quantum Event?
Follow me on Twitter for Real Time Alerts!!
Follow me on StockTwits for UpDates!!
--
--


My guess is $700 ETH then correction down to $300 then off to $1200
Thank you
Bro any new kaboooms?
Great post sir @haejin. We know that, ethereum is a decentralized platform for applications. It is powered by Ether - a cryptocurrency.I think it rates increasing very fast . Keep going sir.. Good wishes for you.
It's a nice post dear @haejin
A brief history of cryptocurrency and some insight into how it works, why it has value, and whether it's a bubble or here to stay.
Great analysis and effective explanation about ETH..
Thanks for such kinds of valuable article buddy @haejin
Very nice your post , your vote on my comment
Hi@haejin i have resteemed your best and informative post.
AXP Please.
Your done a good analysis Bro.. Awsome
Me personally think ETH will break another record this year though lots of Erc_20 token coming.. It will also make new bit ATH which will be unbelievable
thank u do much
Coins mentioned in post:
Great article, thanks for sharing. I've smashed the upvote button for you!
Also, if you are looking to get some tokens without investing or mining check out Crowdholding (https://www.crowdholding.com). They are a co-creation platform were you get rewarded for giving feedback to crypto startups on the platform. You can earn Crowdholding's token as well as DeepOnion, ITT, Smartcash and many other ERC-20 tokens.
Crypto signals - Its notifies about the rise and fall cryptocurrency
Most top traders use this app
https://xsignals.info/?ref=17731
thanks for sharing you always come with great Writting skillss and always write awesome articles keep it up Hope you also visit my blog thanks
Congratulations,
you just got busted with a -100.00% downvote from @punkbuster!
Wanna downvote something yourself?
Just send at least 0.100 SDB or STEEM to
punkbusterwith the post url as memo.This service was brought to you by SteemHQ.com
traded professionally for 15 years but never really used TA, so plz dont beat me up if u and other technicians consider this obvious, just curious:
so what exactly separates this kind of triangle formation as bullish vs bearish, the declining volume? cuz to be honest, anecdotaly i feel like i've seen patterns that look like this that break to the downside as well.
so if you had to pseudo-code it, would it be like
if ascending triangle is observed AND volume is declining then its bullish
else its bearish?
or something different?
also, could you elaborate on what this means, cuz this sounds seriously fucking deep:
thanks dude!
@marketstack Do you see the red candles on volumes? Well, volumes decreasing in such a pattern means that there are less and less sellers to pull the price down. Hence, as volumes decrease, so does the number of seller in a correction (now I'm only talking about THIS ascending right triangle type of pattern). On the other hand, on the chart, candles obviously act the way round: less sellers = price is likely to go on the upside. Still, as a strong resistance remains (the upper blue parallel line on Haejin's chart), it has to be hit several times, which eventually may lead to its weakening and an upward breakout when not even one seller remains.
Here is an actual example of what's going on with Bitcoin:
As far as the 33 other corrective combinations, there are many well written articles on the internet for you to find the answer to your question.
thanks