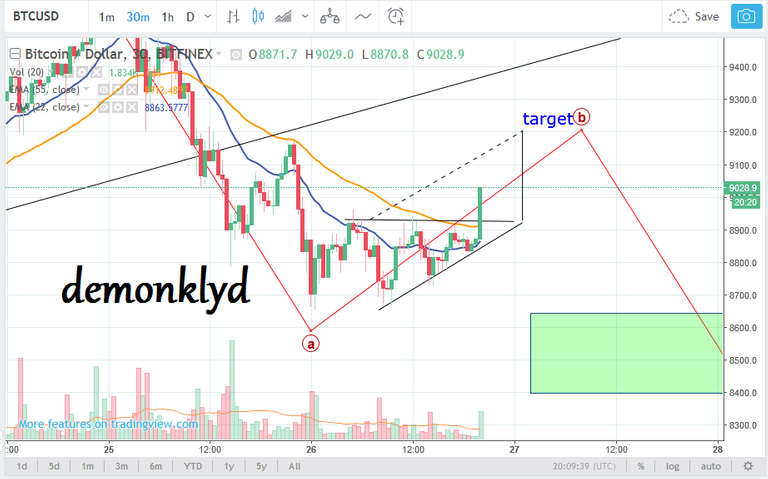
@marketstack Do you see the red candles on volumes? Well, volumes decreasing in such a pattern means that there are less and less sellers to pull the price down. Hence, as volumes decrease, so does the number of seller in a correction (now I'm only talking about THIS ascending right triangle type of pattern). On the other hand, on the chart, candles obviously act the way round: less sellers = price is likely to go on the upside. Still, as a strong resistance remains (the upper blue parallel line on Haejin's chart), it has to be hit several times, which eventually may lead to its weakening and an upward breakout when not even one seller remains.
Here is an actual example of what's going on with Bitcoin:

As far as the 33 other corrective combinations, there are many well written articles on the internet for you to find the answer to your question.
thanks