Hey folks,
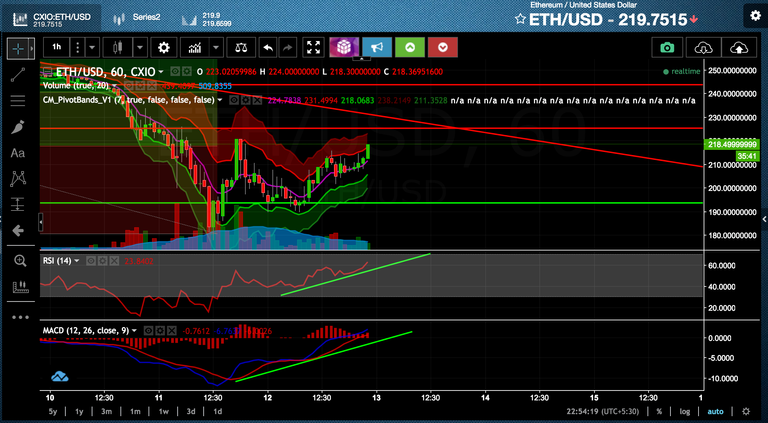
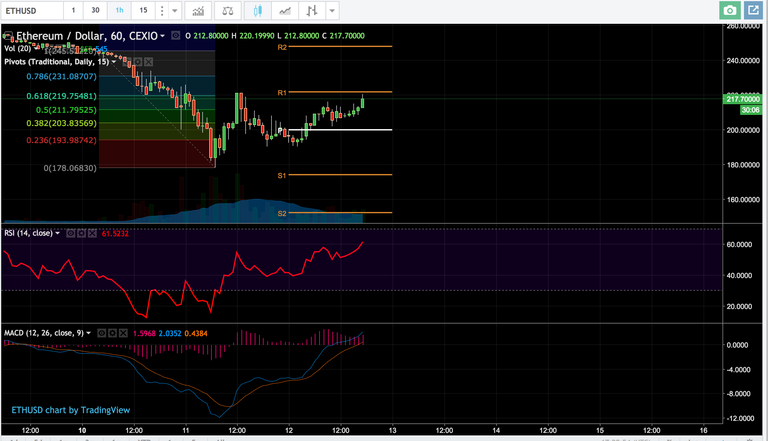
Although MACD and RSI looks very Bullish, lot of resistances $225, $245 present on the upside move.

- Resistance of $220 according to daily pivot band

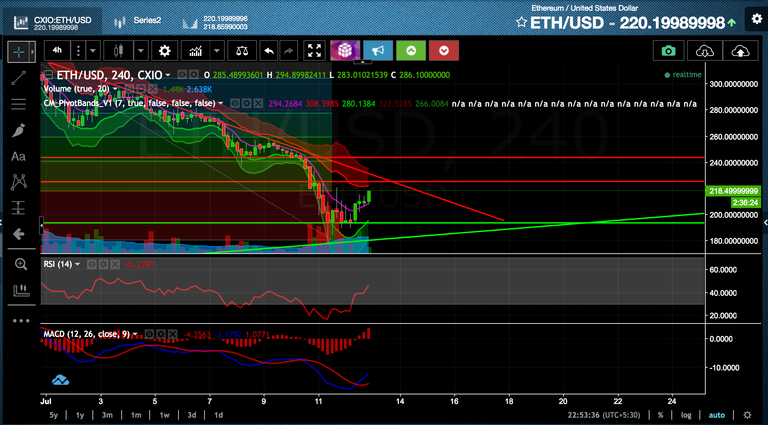
- Weekly Pivot band

Trendlines: Supports and Resistances

- On 4-hourly price chart, MACD is still in bearish zone facing upwards with RSI under 50 level.

Key Highlights :
- Early sign of recovery on hourly price chart of ETH/USD pair
- Still lot of resistances present on the way to bullishness
TBH: I took LONG position at $212 with my Risk management in place. ( I took entry after seeing the price close above pivot line with confirmation of MACD and RSI on hourly chart) Update: => and next candle went to $222
UpVote if you find it helpful, Resteemit to spread the words, Follow Me for more updates and cryptocurrency technical analysis.
Join My Channel at Telegram to get Trading Signals : Crypto Trading Technical Analysis
GREAT TA here I also have resistance at 220 and looking for solid break through 240 for a real recovery to occur.
i Would like to introduce a very simple question, which i hope the present participants find oddly enough to share thoughts and ideas. I have some previous info that i can share but i wanted to ask you guys first to have a free and open moment of discussion.
¿ Do you think that in this very early stage of develop phase, technical analysis, the type of analysis that captures the sentiment of the crowd, applies to crypto currencies ?
¿Does anyone here has some info, experience or material about the orderbook analysis of them and trading according to that ?
thanks everyone.
If you like to keep sharing ideas about the technology and business about a cryptocurrency, please follow me @sono.arquetip. Always something new and interesting.