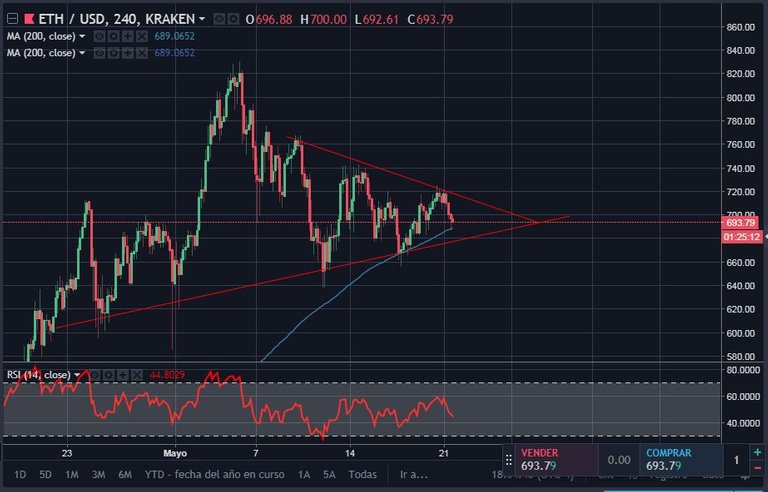
The price is just above the DMA 200 line in 4 hour and 1 day sails. The RSI is in a balanced zone.... Let's just say the price is consolidated right now. But there is a clear upward trend. One would expect a rebound on the DMA 200 line.
It's also clear that it's a symmetrical triangle that's about to burst.... I think an entry right now would not be bad. A good impulse could come along to try to break the symmetrical triangle.
