MATLAB or Matrix Laboratory is used by engineers, scientists and students in many fields such as image and signal processing, communications, control systems for industry, smart grid design, robotics as well as computational finance.
Uses for MATLAB include matrix calculations, developing and running algorithms, creating user interfaces (UI) and data visualization. The multi-paradigm numerical computing environment allows developers to interface with programs developed in different languages, which makes it possible to harness the unique strengths of each language for various purposes.
For this simulation we will get the line current's value and its sinusoidal waveform. As requisite from my last post using Multisim.
First open a new script for a new text editor.
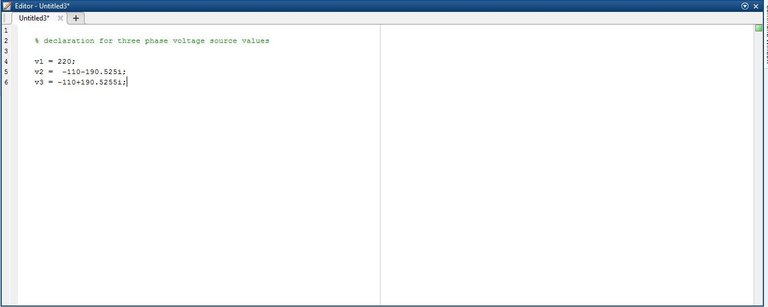
Now we declare the voltage source values in trigonometric form. Since it is easier for me to input in that complex form.
220 volts = 220 bar angle 0 º v
-110-190.525i v = 220 bar angle -120º v
-110+190.5255i v= 220 bar angle 120º v
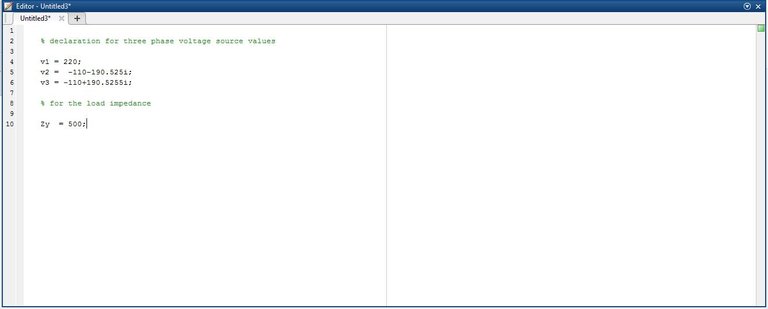
And for our load impedance simply 500 ohms because it is resistive.
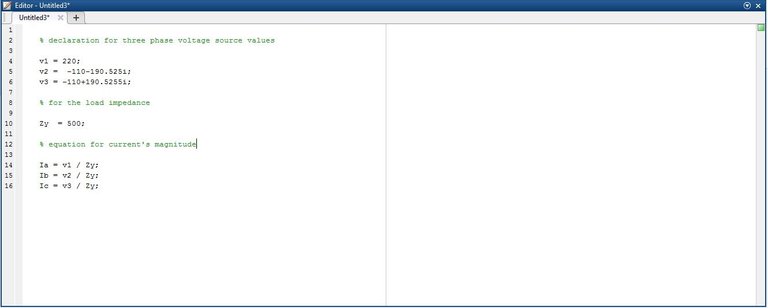
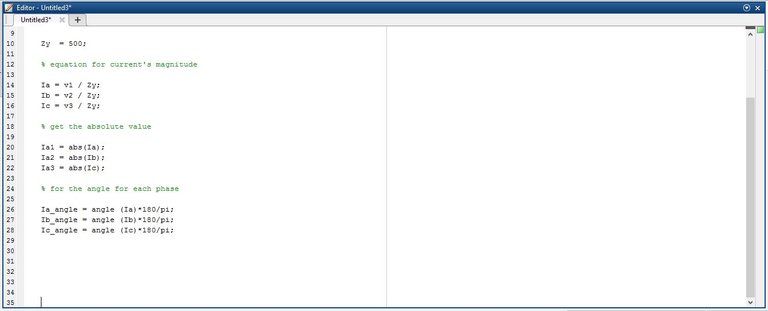
Make an equation based on per phase analysis to get the line current.
Since source is already at phase voltage.
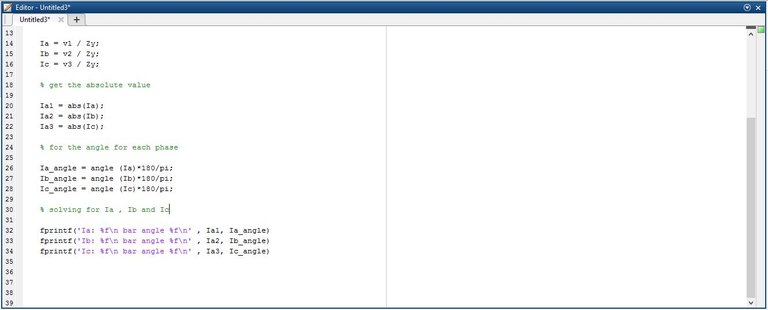
Make your values in absolute form first and then we are now solving for its phase angle by multiplying it by 180/╥ because we don't want to make it in radians.
Using fprintf() we will now get our answers to view at command window.
And hit Run.
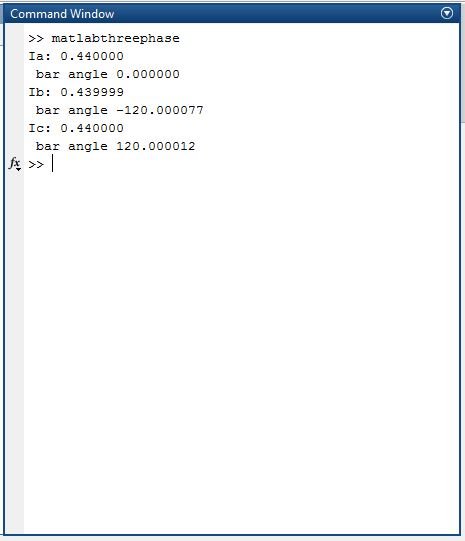
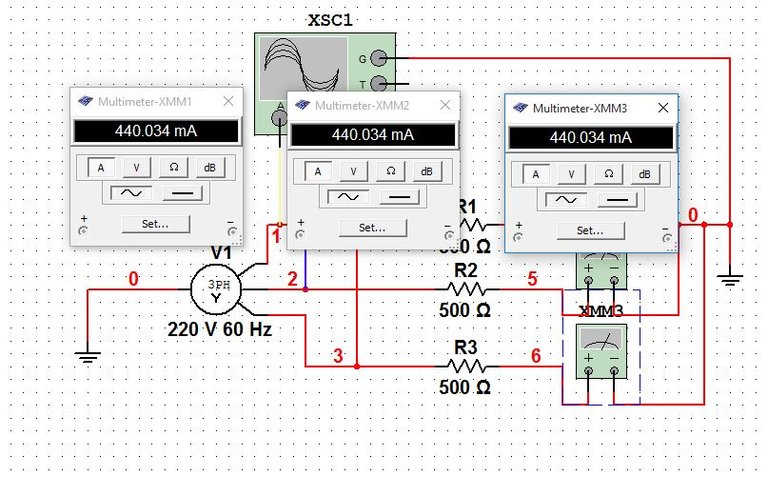
Comparing both answers in different softwares.

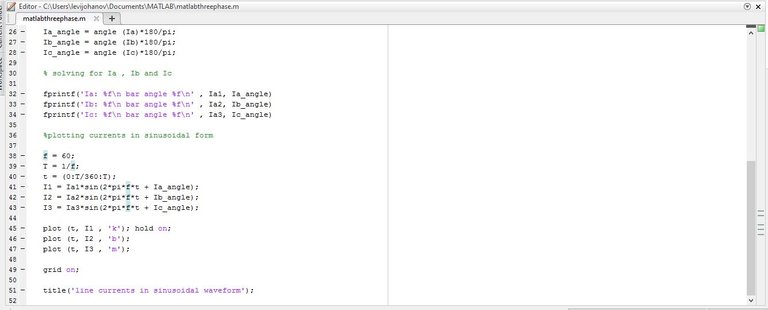
Time for waveform plotting. Using the formula = Im*sin(2╥ft) + Θº ; f = 60 Hz , T = 1/f , t = (0:T/360:T).
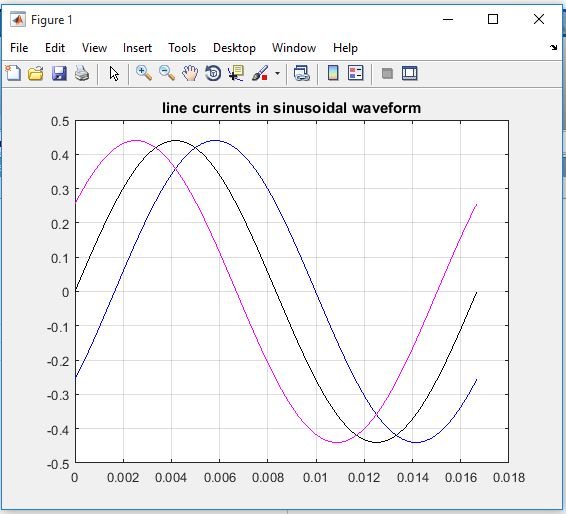
And there you go, your three phase waveform with 120º of phase difference.
*In this post, I am using a C language you can still iInterface it with other programs written in other languages, including ,C++, C#, Java, Fortran and Python.
THANKS FOR READING , I HOPE YOU WILL FIND IT VALUABLE ☺
Very truly yours. @leviticusjohan
photocredits

