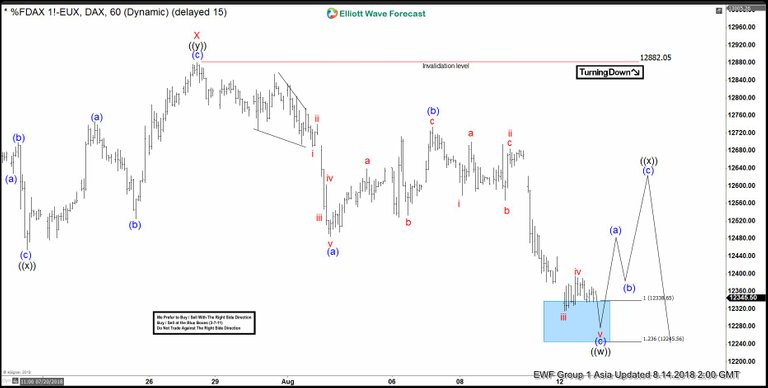
DAX short-term Elliott wave analysis suggests that the rally to 12882.05 high ended Minor wave X bounce. The internals of that bounce unfolded as Elliott wave double three structure where Minute wave ((w)) ended at 12640.87. Minute wave ((x)) ended at 12468.68 and Minute wave ((y)) of X ended at 12882.05 high. Down from there, the decline is showing the overlapping price action suggesting that the decline in Minor wave Y is taking place as 3 wave corrective sequence i.e either ((w)),((x)),((y)) or ((w)),((x)),((y)),((x)),((z)) structure in Minute degree.
The initial decline from 12882.05 high is unfolding as Elliott wave zigzag correction in Minute wave ((w)) lower. Where minutte wave (a) ended in 5 waves structure at 12494 low. Up from there, the bounce to 12740.12 high ended Minutte wave (b) bounce in 3 swings. Decline from there is taking place in another 5 waves structure & reached the 12338.65-12245.56 100%-123.6% Fibonacci extension area of (a)-(b) to end Minutte wave (c) of ((w)). And soon, the index is expected to do a Minute wave ((x)) bounce in 3, 7 or 11 swings against 12882.05 high before further decline in Minute wave ((y)) of Y is seen. We don’t like selling it.
DAX 1 Hour Elliott Wave Chart

Hi! I am a robot. I just upvoted you! I found similar content that readers might be interested in:
https://www.fxstreet.com/analysis/dax-elliott-wave-analysis-bounce-can-be-temporary-201808140504