Hey everyone!! So as a first post I thought it'd be cool to share some knowledge on the basics of technical analysis - here I'll be breaking down trend lines; what they are, how to draw them, and how to profit from them, let's get started!
Trend line analysis is very easy to implement within any financial market. Understanding the concept of a "Trend" is important to for the implementation of technical analysis. We've all heard that expression "The Trend Is Your Friend" but why is that true and is it always true? I'll answer those later on.
First of all whats a trend? Simply put, a trend is the direction of the market. This is important so that you can properly place yourself in a profitable position within the market. There are three types of trends that a market will display at any given time. These are; an up trend, a down trend and a sideways trend aka a trendless period (Most know this period as a consolidation period, and intra-day traders may consider this period within the market as a trading range).
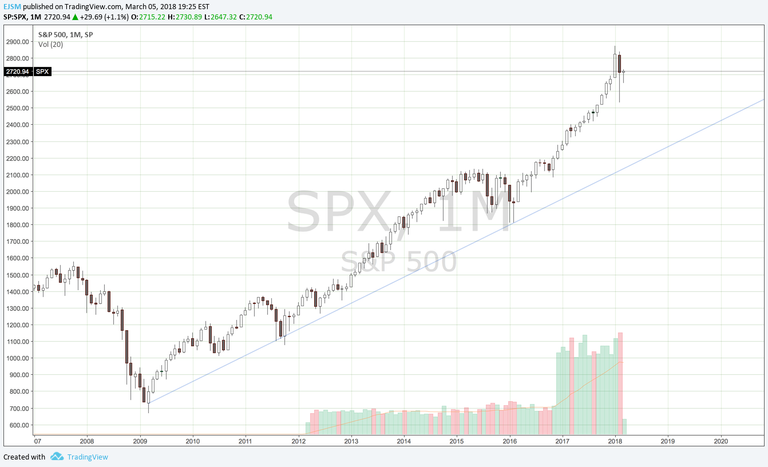
SPX Monthly Chart - Up trend
The image above demonstrates an up trend (blue line) beneath the S&P 500 Index
Note that the line has been drawn below the market. It's essential to know the following: during bull markets the line is to be drawn below the market, and during a bear market the line is to be drawn above the market as shown in the following.
(Bull(ish) = Up/Buy | Bear(ish)=Down/Sell)
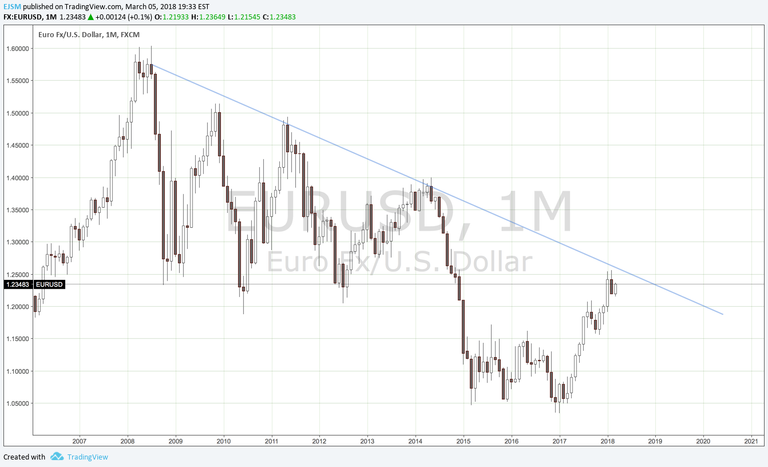
EURUSD Monthly Chart - Down Trend
Why should they be drawn above/below? As the market proceeds along it's trend you must know that the trend will not hold its place for an infinity amount of time. Eventually it will break...
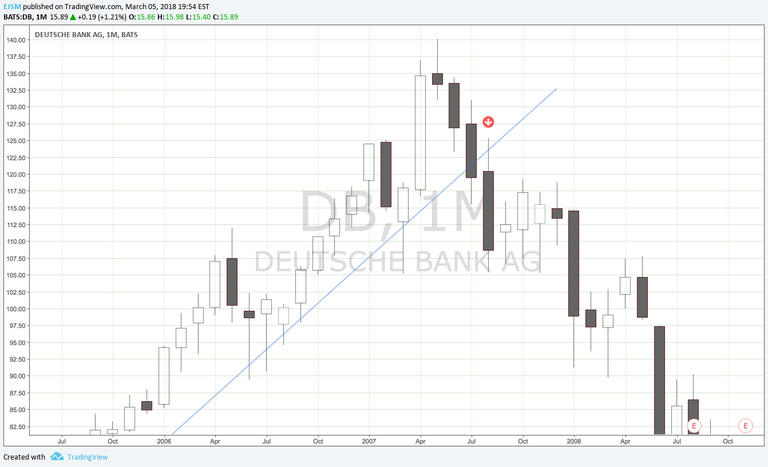
DB Monthly Chart - Trend Break
The market above demonstrates blatant disrespect on our trend. This would be a clear signal to secure profits and maybe even place shorts against the market.
The Three Trend Split
During and up or down trend it isn't uncommon to experience a trend split.
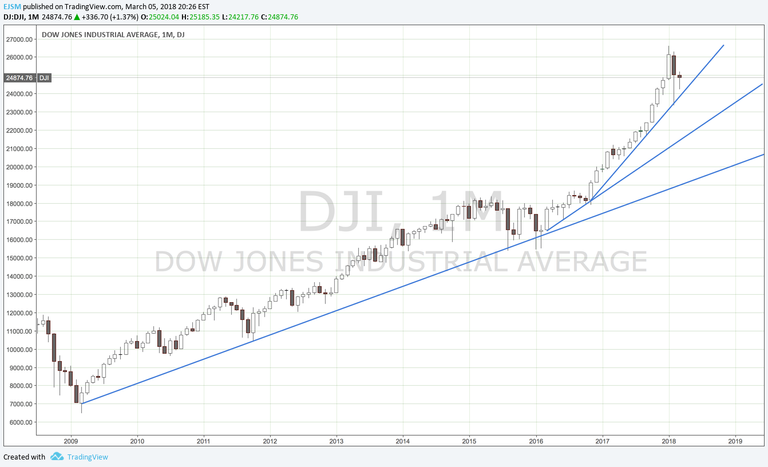
DJI Monthly Chart - Three Trend Split
The first trend (most bottom trend) is considered a major / main trend line because it has moved along respectfully for a longer period of time (2009 - 2016)
The secondary trend is not considered a major trend line because it has been actively respected for less than 12 months within the 2016 period.
The final trend line is always assumed to be the final impulsive move upwards, and is typically rendered unstable because of its steepness. On average most stable trend lines tend to approximate an average slope of 45 degrees.
If the trend line is too steep it typically means that the speed in which the market is ascending/descending in is not stable at all and should be expected to break.
A up/down trend line that is too flat indicates that the up/down trend is too weak.
How do we implement a trend line to become profitable within the market?
There's typically a two point touch rule to use when utilizing trend line analysis.
A conformation point and a validation point.
I use a two point touch rule as demonstrated below:
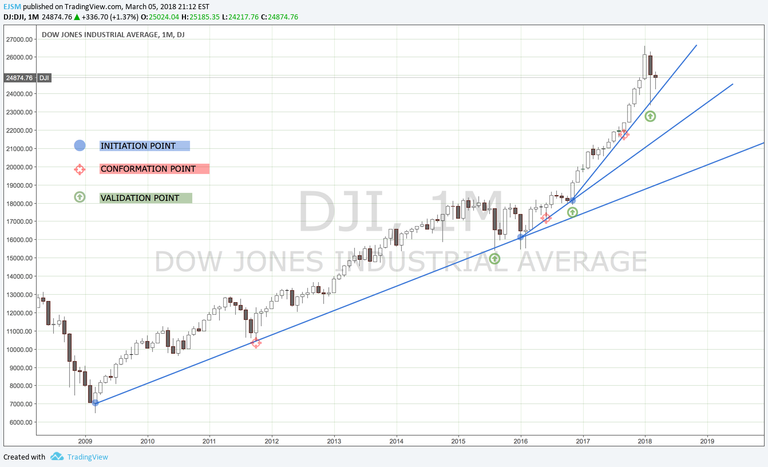 DJI Monthly Chart - Con.+Val. Point Demonstration
The rules are applied the same to a down trend.
Befriending the trend is intelligent especially if you want to place yourself in a profitable position, but the key relies on knowing when to position yourself in the market when using trend line analysis because it doesn't always hold true... The trend is your friend until it's not. Understanding how to implement trend line analysis is one of several tools that a profitable TA trader may use. Understanding when the market may reverse is crucial and implementing trend line analysis alone won't yield the most effective results. If you enjoyed this so far and wish to see more share some love!
The Consolidation Period
When the market has no trend, it means that it is consolidating... and this is what that looks like:
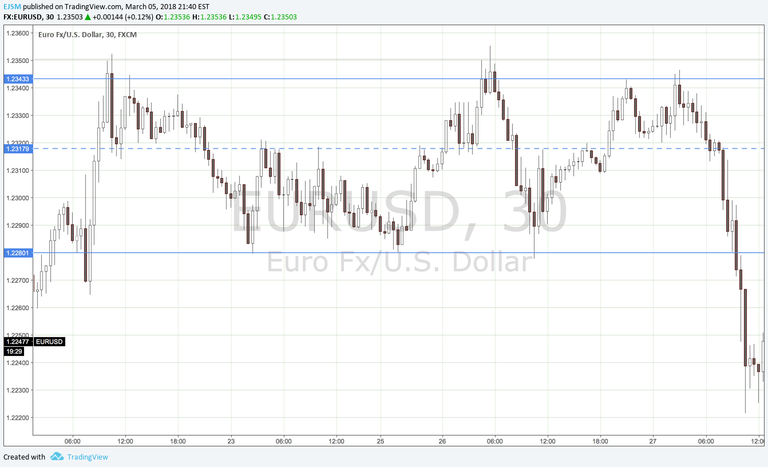 EURUSD 30 Minute Time Frame - Trendless
Consolidations occur when theres a equilibrium in price level where supply and demand remain relatively the same.
I would personally advise against part taking in this period of the market especially if you're on a leveraged account.
Those blue horizontal lines get into support and resistance which I will get into on another post... or if you wish, you can see the video on it below. Thanks a ton for reading, Until next time :)
Trend Line Analysis (4:58)
Support and Resistance (9:51)
--S&R- 0:00 - 7:09
--Identifying a Trading Range- 7:27 - END
Find me on other social platforms -
IG: @MannyTheTrader
TradingView: @EJSM