Los mercados financieros son muy cambiantes y algunas criptomonedas son muy volátiles y necesitamos un método de automatizar este proceso para no estar pegados a la pantalla viendo las gráficas todo el día, y así podremos dedicar más tiempo a realizar otras tareas. Dicho esto, en este post crearemos un bot o un código para automatizar las órdenes de compra o de venta en función de ciertos parámetros como el precio o ciertos indicadores financieros.
Financial markets are very changeable and some cryptocurrencies are very volatile and we need a method to automate this process so we are not glued to the screen watching the charts all day, and so we can spend more time doing other tasks. That said, in this post we will create a bot or code to automate buy or sell orders based on certain parameters such as price or certain financial indicators.
En mi último post vimos como extraer datos de la exchange de Binance. y almacenarlos en hojas de cálculo automáticamente utilizando la API de Google Sheets, te invito a verlo. Allí había un código que no se tocó a profundidad, pero es la base para crear nuestro Trading Bot, sin nada más que decir ¡Comencemos
In my last post we saw how to extract data from the Binance exchange and store them in spreadsheets automatically using the Google Sheets API, I invite you to see it. There was a code that was not touched in depth, but it is the basis for creating our Trading Bot, nothing more to say, let's start!
En día de hoy, hablaremos cobre como extraer datos desde Binance utilizando JavaScript o el lenguaje Python y luego se explicará como hacer que el Trading bot realice un pequeño análisis técnico y sea capaz de crear órdenes de compra y órdenes de venta.
Today, we will talk about how to extract data from Binance using JavaScript or the Python language and then we will explain how to make the trading bot perform a little technical analysis and be able to create buy and sell orders.
El proceso es el siguiente:
- Nuestra aplicación realizará una petición HTTP o se suscribirá a un flujo de datos de un websocket, que nos provee Binance.
- El endpoint nos devolverá los datos en tiempo real en un formato JSON (Javascript Object Notation), que se basa en pares {clave: valor}.
- Una de las claves es
"k"referida al candlestick (vela japonesa), la cual nos muestra un precio de apertura, un precio de cierre, un valor mínimo y un valor máximo. - Utilizaremos el indicador RSI para saber si la divisa está sobrecomprada o sobrevendida, si lo está, el bot creará una orden de venta o de compra, respectivamente, utilizando la clave de API de Binance.
The process is the following:
- Our application will make an HTTP request or subscribe to a websocket data stream from Binance.
- The endpoint will return to us real-time data in a JSON format (Javascript Object Notation), which is based on {key: value} pairs.
- One of the keys is "k", refered to candlestick, this has an open price, close price, minimum value and maximun valu
- We will use the RSI indicator to know if the currency is overbought or oversold, if it is, the bot will create a sell order or a buy order, respectively, using our Binance API Key.
En primer lugar, veamos un repaso de como obtener datos de Binance, utilizando Websockets.
¿Qué son las Velas Japonesas?
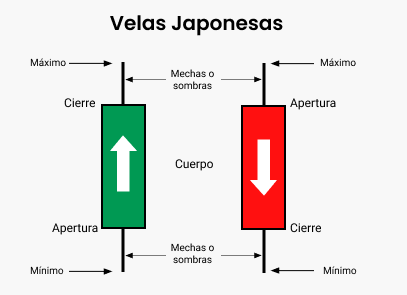
Las velas son verdes cuando el precio de cierre es mayor que el precio de apertura e indica que el precio ha aumentado en ese periodo. Mientras que la vela es de color rojo cuando el precio de cierre es inferior al precio de apertura, lo que indica que el valor del activo ha disminuido en ese periodo, generalmente este fenómeno ocurre por una venta desesperada.
Obtener datos de las velas japonesas usando JavaScript
In JavaScript is so easy, to get data from the Binance websocket you only have to:
- Create a WebSocket object:
const binanceSocket = new WebSocket('wss://stream.binance.com:9443/ws/cakeusdt@kline_3m');
The base URL: wss://stream.binance.com:9443/ws/
The coin pair: cakeusdt
@
trade to see the all the recent trading operations.
or
kline_ to see the candlestick data + the time period: 1m 3m 5m 15m 1h 4d, etc.
2.Create an event listener for catching the endpoint messages:
binanceSocket.onmessage = function (event){
            console.log(event.data);

            //To parse JSON format into a JavaScript Object
            var messageObject = JSON.parse(event.data);

         //Inside a div, put in a paragraph the open price, the close price, higher and lower value.
            tradesDiv.innerHTML+=`<p>Higher value: ${messageObject.k.h}
                                     Open Price:  ${messageObject.k.o}
                                     Close Price: ${messageObject.k.c}
                                     Lower value: ${messageObject.k.l}
                                  <p>`
 }
This is the full code, written in a basic index.html file:
<!DOCTYPE html>
<html lang="en">
<head>
    <meta charset="UTF-8">
    <meta http-equiv="X-UA-Compatible" content="IE=edge">
    <meta name="viewport" content="width=device-width, initial-scale=1.0">
    <title>Document</title>
</head>
<body>
    <h2>Candlestick data (Velas japonesas)</h2>
    <div id="trades"></div>

    <script type="text/javascript">

        var tradesDiv = document.getElementById("trades");
        const binanceSocket = new WebSocket('wss://stream.binance.com:9443/ws/cakeusdt@kline_1m');

        binanceSocket.onmessage = function (event){
            console.log(event.data);

            var messageObject = JSON.parse(event.data);
            tradesDiv.innerHTML+=`<p>Higher value: ${messageObject.k.h}
                                     Open Price:  ${messageObject.k.o}
                                     Close Price: ${messageObject.k.c}
                                     Lower value: ${messageObject.k.l}<p>`
        }
    </script>
</body>
</html>
With this code, if you open it in a local server you you will see all the candlestick data with 4 atributes: (higher value, open price, close price and lower value both on the console and the webpage.
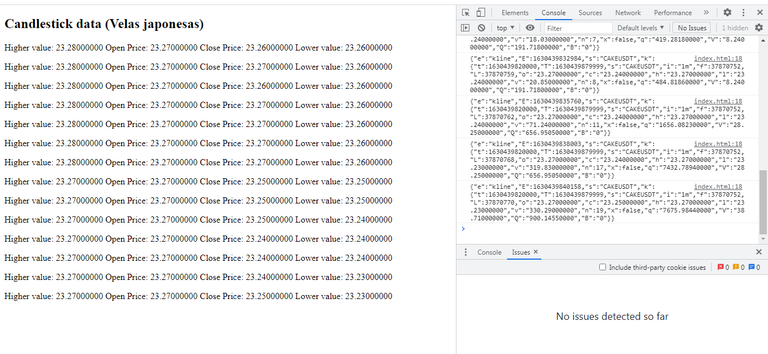
Then, we need to show all the data in a better organized way and finnaly extract maeaningful information from it.
Well, We extracted data from Binance and printed it in the console. Now We will create a Python client to connect to Binance websocket, retrieve the data, do some technical analysis and excecute buy and sell orders.
Crear el entorno virtual de Python
Utilizaré Virtual Studio Code para realizar este proyecto, y primero crearé un entorno virtual.
I will use Virtual Studio Code for making this project, and first I will create a virtual enviroment.

Escribe el siguiente comando en tu terminal para crear un entorno virtual aislado para tu proyecto.
Write the following command in your terminal for creating an isolated virtual enviroment for your proyect.
python -m venv name_of_your_enviroment
A continuación, tendrá que activarlo:
Then you will need to activate it:
source name_of_your_enviroment/Scripts/activate
Ahora, todos los módulos se instalarán únicamente en esta carpeta.
Es necesario utilizar el comando de cambio de directorio para cambiar a la carpeta real del proyecto:
cd name_of_your_enviroment
Now, every module will be only installed in this folder.
You need to use change directory command to swap to the actual folder of the project.
Instalar los paquetes o módulos necesarios
Utilizaré la biblioteca de Python para conectar con la API pública de Binance, un repositorio que puedes encontrar aquí:https://github.com/binance/binance-connector-python
I will use the Python library for connecting to the Binance Public API, a repository that you can find in the link above.
Luego, en tu terminal debes escribir los siguientes comandos, uno por uno:
Then, in your terminal you need to write the following commands, one by one:
pip install binance-connector
pip install websocket-client
pip install numpy
pip install TA-Lib
binance-connector instalará todos los paquetes o módulos que necesitarás para operar dentro de Binance. Por ejemplo: Creación de una Orden de Mercado Spot. Por otro lado, necesitaremos otras librerías llamadas: numpy (para operaciones numéricas y arrays), websocket-client para suscribirse a un websocket de Binance y recuperar los datos, y TA-Lib para el Análisis Técnico.
This will install all the packages or modules you will need to operate inside Binance. For example: Creating a Spot Market Order. On the other hand, we will need other libraries named: numpy (for numerical and arrays operations), websocket-client to subscribe to a Binance websocket and retrieve the data, and TA-Lib for Technical Analysis.
Para cualquier paquete que quieras instalar tienes que escribir:
For any package you want to install you have to write:
pip install name_of_the_package
Si quieres instalar todas las dependencias de forma más rápida, puedes crear un archivo requirements.txt con todos los nombres de los módulos o librerías que vamos a utilizar
If you want to install all the dependencies in a faster way, you can create a requirements.txt file with all the names of the modules or libraries we are going to use
Requirements.txt:
binance-connector
TA-Lib
numpy
pandas
websocket-client
Después de guardarlo tienes que escribir el siguiente comando en la terminal y todo los paquetes serán descargados e instalados:
pip install -r requirements.txt
After you saved it, you have to write the command showed above in your terminal and everything is going to be downloaded and installed.
URLs para obtener datos de Binance
Para obtener datos desde la exchange de Binance puedes utilizar su REST API o también pueden utilizar Websockets. A través de los siguientes URLs:
| Spot API URL | Spot Test Network URL |
|---|---|
| https://api.binance.com/api | https://testnet.binance.vision/api |
| wss://stream.binance.com:9443/ws | wss://testnet.binance.vision/ws |
| wss://stream.binance.com:9443/stream | wss://testnet.binance.vision/stream |
Los límites de IP y de tasa de órdenes en la red de prueba de Spot son los mismos que en la API de Spot. Para mejorar los resultados, primero podríamos utilizar la red de pruebas para no cometer errores con dinero real, pero el mecanismo es el mismo, si queremos operar con dinero real sólo hay que cambiar una línea de código.
IP Limits and Order Rate Limits on the Spot Test Network are the same as on the Spot API. For improving results, first we could use the testnet for not making errors with real money, but the mechanism is the same, if we want to trade with real money you only have to change one line of code.
Lógica principal
Para este tutorial utilizaremos websockets, con el fin de no sobrecargar los servidores de Binance haciendo peticiones, solo recibiremos sus mensajes. Todo el código que se escriba a continuación debe colocarse dentro de un carhivo de Python, al que puedes nombrar: index.py. En primer lugar, importamos las bibliotecas a utilizar:
import os
import json, pprint, time
import numpy as np
import talib
from binance.enums import *
from binance.spot import Spot
import websocket
Definimos a que socket queremos conectarnos según el par de monedas y definimos cuatro constantes relacionadas al RSI, el número de periodos que es 14, el valor que indica sobre compra (70), el valor que indica sobreventa (30) y la cantidad que vamos a intercambiar en cada orden.
SOCKET = "wss://stream.binance.com:9443/ws/hiveusdt@kline_1m"
TRADE_SYMBOL = "HIVEUSDT"

RSI_PERIOD = 14
OVERSOLD_THRESHOLD = 30
OVERBOUGHT_THRESHOLD = 70
TRADE_QUANTITY = 1
Luego definimos 4 variables globales, que serán modificadas cada vez que cierre una vela japonesa, tres arreglos o arrays que almacenan los mínimos, los máximos y los precios de cierre. Una variable muy importante es in_position, que es la que impedirá que vendamos cuando no tenemos la moneda o evitar que compre indefinidamente, acabando los fondos:
open_price = 0.0
closes = []
maximos = []
minimos = []
in_position = False
El siguiente paso es crear un cliente de Binance, que tenga acceso a tu billetera Spot y que pueda hacer operaciones:
#Acceder a tus variables de entorno para no mostrar las claves en tu código
API_KEY = os.environ["BINANCE_API_KEY"]
SECRET_KEY = os.environ["BINANCE_SECRET_KEY"]

#Usa esta línea cuando quieras crear un cliente en la mainnet (Fondos reales)
#client = Spot()

#Usa esta línea cuando quieras crear un cliente en la testnet (Dinero de prueba)
client = Spot(base_url='https://testnet.binance.vision')

print(client.time())

#Accedemos nuestra cuenta de Binance utilizando nuestras dos claves: API y SECRET
client = Spot(key=str(API_KEY), secret=str(SECRET_kEY))

#Obtener información de tu cuenta (Devuelve un largo diccionario de tus balances)
print(client.account())
These are your secret private keys, the plain text should not be in the code, this is why we use enviroment variables.
API_KEY = os.environ["BINANCE_API_KEY"]
SECRET_KEY = os.environ["BINANCE_SECRET_KEY"]
Pero para hacer esto, necesitarás dos claves, la clave de API y la clave secreta, las cuales puedes obtener en el siguiente enlace, luego de iniciar sesión:
https://www.binance.com/es/my/settings/api-management
Crea una clave de API para acceder a tu cuenta de Binance
Para que nuestro código pueda realizar órdenes de compra y venta o manejar nuestros activos, tenemos que iniciar sesión en nuestra cuenta de Binance y nos dirigimos a la parte de cuenta donde dice "Gestión de API". Cada cuenta puede crear hasta 30 claves API para sus proyectos de automatización.
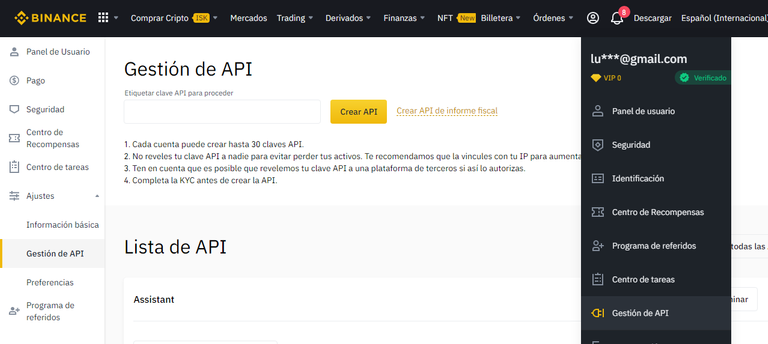
Es importante que no reveles tu clave API a nadie para evitar perder tus activos. El equipo de Binance te recomienda que la vincules con tu IP para aumentar la seguridad de tu cuenta. Si la revelas por accidente, inmediatamente tendrás que borrar esa clave de API en el mismo menú y crear otra.
Le colocas un nombre en ese espacio, presionas el botón de crear API y luego realizas los pasos de verificación de seguridad KYC.
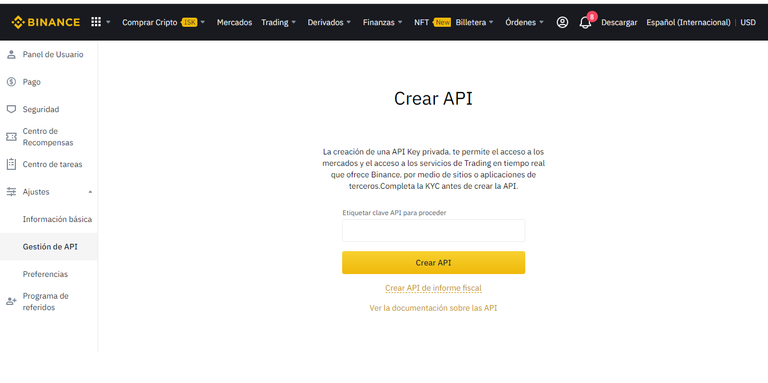
Obtendrás dos claves privadas, la clave de API y la clave secreta, una secuencia larga de letras y números que te permitirán realizar operaciones dentro de la plataforma Binance, cópialas en tu portapapeles y no las pierdas de vista.
Necesitarás crear tus propias variables de entorno, si estás en Windows, ve a Mi PC --> Propiedades --> Configuración avanzada --> Variables de entorno --> Nueva:
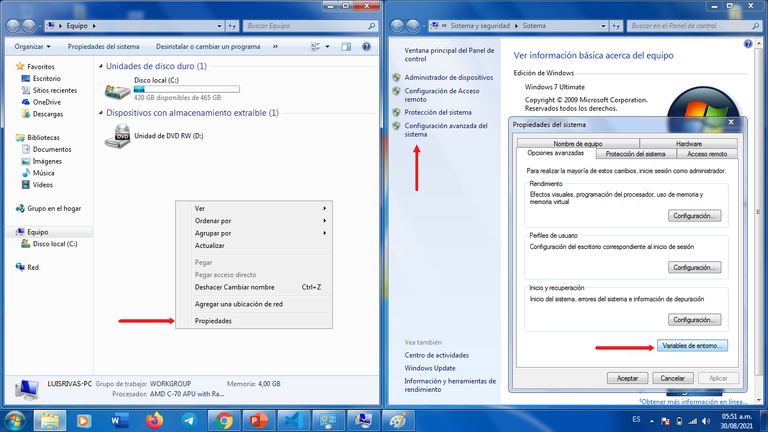
He creado estas dos variables:
BINANCE_API_KEY
valor: Tu clave API de Binance
BINANCE_SECRET_KEY
valor: Tu clave secreta de Binance
Guárdalo, y a veces tienes que cerrar tu editor de código y abrirlo de nuevo. Estas dos variables están en mi código.
You need to create your own enviroment variables, if you are in windows, go to MY PC --> Properties --> Advanced Configuration --> Enviroment Variables --> New.
I created these two variables:
BINANCE_API_KEY
value: my API key from binance
BINANCE_SECRET_KEY
value: my secret key from binance
Save it, and sometimes you need to close your code editor and open it again.
Para conectarte a un websocket, además de pasarle la URL, tendrás que definir tres métodos, on_open para que indique cuando nos hemos conectado, on_close, para que nos indique cuando el websocket se ha cerrado y el más importante on_message, que definirá qué haremos con cada mensaje recibido de los servidores a donde nos conectamos, en este caso Binance.
#Websockets events
def on_open(ws):
    print("Opened")

def on_close(ws):
    print("Closed connection")

def on_message(ws, message):
    global open_price, closes, in_position, maximos, minimos

    ##Convert the received message in JSON format into a Python Object
    message = json.loads(message)
    #Get the candlestick (k) and verify it is closed
    candle = message['k']
    timestamp = candle['t']
    candle_is_closed = candle['x']

    #if it is closed get the close price: candle['c']
    if candle_is_closed:
        open_price = float(candle['o'])
        closes.append(float(candle['c']))
        minimos.append(float(candle['l']))
        maximos.append(float(candle['h']))

        num_closes = len(closes)
        print(closes)

        if num_closes > RSI_PERIOD:
            np_closes = np.array(closes)

            #Use Technical Analysis Library to get RSI value of our price data.
            rsi = talib.RSI(np_closes, timeperiod=RSI_PERIOD)
            print("All RSIs calculated so far")
            print(rsi)

            #Get the last RSI
            last_rsi = rsi[-1]
            print("RSI is {}".format(last_rsi))

            #if the last RSI is greater than 70 then we will create a sell order
            if last_rsi > OVERBOUGHT_THRESHOLD:
                print("It is overbought")

                #Verify if we are in position, to avoid selling over and over again
                if in_position:
                    print("Sell! Sell! Sell!")
                    #Create a sell order
                    order_succeeded = order(SIDE_SELL,TRADE_QUANTITY, TRADE_SYMBOL, ORDER_TYPE_MARKET)
                    if order_succeeded:
                        in_position = False
                else:
                    print("It is overbought, but we don't own any. Nothing to do here. ")
            #if the last RSI is less than 30 then we will create a buy order
            if last_rsi < OVERSOLD_THRESHOLD:
                print("It's oversold.")
                #Verify if we are in position, because we don't have infinite money
                if in_position:
                    print("You are already in the position. Nothing to do here.")
                else:
                    print("Buy! Buy! Buy!")
                    #Create a buy order
                    order_succeeded = order(SIDE_BUY, TRADE_QUANTITY, TRADE_SYMBOL, ORDER_TYPE_MARKET)
                    if order_succeeded:
                        #Now we have possesion of the coin
                        in_position = True
Muy bien, ya tenemos los eventos, pero otro paso muy importante es conectarnos al websocket, escribiendo las siguientes dos líneas:
ws = websocket.WebSocketApp(SOCKET, on_open=on_open, on_close=on_close, on_message=on_message)
ws.run_forever()
Creación de órdenes de compra y de venta en Binance
A continuación se muestra la función para crear ordenes de compra o de venta usando la API de Binance. Esta función debe colocarse antes de los eventos del websocket, especialmente antes de on_message. Como pueden leer en el código de abajo, se utiliza el método client.new_order() y se le pasan varios parámetros como un diccionario de Python:
def order(side, quantity, symbol, order_type):
    try:
        params = {
            'symbol': symbol,
            'side': side,
            'type': order_type,
            'timeInForce': 'GTC',
            'quantity': quantity,
        }
        order = client.new_order(**params)
        print("Order info")
        print(order)
    except Exception as e:
        print("There was an error")
        print(e)
        return False
    return True
Estos parámetros son los siguientes:
symbol: Es el par de criptomonedas que quieres intercambiar.
side: Aquí específicarás si quieres comprar
"BUY"o vender"SELL"type: el tipo de orden que deseas enviar, puede tomar los siguientes valores:
LIMITMARKETSTOP_LOSSSTOP_LOSS_LIMITTAKE_PROFITTAKE_PROFIT_LIMITLIMIT_MAKER
timeInForce Cómo deseas que se ejecute la orden:
GTC: Válida hasta que se cancele.FOK: (llenar o matar). Emitir la orden una sola vez o cancela.IOC: (inmediato o cancelado). Que la orden se realice de inmediato oque se cancele. En búsqueda de rapidez.
quantity: La cantidad de criptomoneda que deseas vender.
price: el precio al que deseas vender. Para el par BTCUSDT, el monto se expresa en USDT.
Es importante que tu ordenador tenga la hora sincronizada con los servidores de Binance para recibir la respuesta dentro de la recvWindow definida, o de lo contrario se producirá un error.
It's important that your computer has synchronized time with Binance servers time to receive response within the defined recvWindow, or else it will produce an error.
Para ejecutar el código tienes que escribir el siguiente comando en tu terminal (asegurándote que estés en la carpeta de tu entorno):
python index.py
¿Cómo funciona el código?
Nuestro cliente se suscribe a un websocket y se encarga de interpretar los mensajes recibidos. Cada vez que se recibe un mensaje, se leen datos del precio de cierre de la criptomoneda y los analizamos utilizando la biblioteca de TA-Lib (Technichal Analysis Library).
Al utilizar websockets, nuestro cliente estará siempre escuchando nuevos datos en lugar de hacer peticiones. Binance proporciona flujos de datos y todos ellos tienen diferentes nombres. Tienen flujos con nombres como:
- BTCUSDT
- ETHUSDT
- HIVEUSDT
- SOLUSDT
As we are using websockets, our client will be always listening to new data instead of making requests. Binance provide streams of data and all of them have different names. They have streams named like the metioned above.
Este es un ejemplo de un mensaje que envía constantemente la conexión al web socket:
{
  "e": "kline",     // Event type
  "E": 123456789,   // Event time
  "s": "BNBBTC",    // Symbol
  "k": {
    "t": 123400000, // Kline start time
    "T": 123460000, // Kline close time
    "s": "BNBBTC",  // Symbol
    "i": "1m",      // Interval
    "f": 100,       // First trade ID
    "L": 200,       // Last trade ID
    "o": "0.0010",  // Open price
    "c": "0.0020",  // Close price
    "h": "0.0025",  // High price
    "l": "0.0015",  // Low price
    "v": "1000",    // Base asset volume
    "n": 100,       // Number of trades
    "x": false,     // Is this kline closed?
    "q": "1.0000",  // Quote asset volume
    "V": "500",     // Taker buy base asset volume
    "Q": "0.500",   // Taker buy quote asset volume
    "B": "123456"   // Ignore
  }
}
Entre los datos de la vela japonesa se encuentra el precio de apertura ['o'], el precio de cierre ['c'], el máximo valor ['h'] y el mínimo valor de mercado ['l']. Pero un aspecto muy importante es verificar si la vela ya cerró ['x'], ya que el websocket nos envía distintos mensajes que pertenecen a la misma vela y tienen un timestamp similiar. Cuando cierra, el atributo "x" se vuelve True e inicia otra vela con otros valores.
Among the Japanese candlestick data are the opening price
['o'], the closing price['c'], the maximum value['h']and the minimum market value['l']. But a very important aspect is to verify if the candle has already closed['x'], since the websocket sends us different messages that belong to the same candle and have a similar timestamp. When it closes, the attribute "x" becomes True and starts another candle with other values.
El mecanismo del bot es el siguiente: si cerró la vela, se almacena el precio en que cerró dicho activo.
De estos datos, nos enfocaremos en el precio de cierre y lo guardaremos en un Array o lista de elementos.
Este Array de precios lo analizaremos utilizando la biblioteca de TA-Lib (Technichal Analysis Library) de Python utilizando el RSI como indicador.
- The bot mechanism is as follows: if the candle closed, the price at which the asset closed is stored.
- From this data, we will focus on the closing price and store it in an Array or list of elements.
- This Array of prices will be analyzed using Python's TA-Lib (Technichal Analysis Library) using the RSI as an indicator.
El RSI (Índice de fuerza relativa) es un indicador utilizado en el análisis técnico, es uno de los más fáciles de interpretar y refleja la fuerza relativa de los movimientos alcistas en comparación con los movimientos bajistas. Fue ideado por J. Welles Wilder y según su estudio estableció que si el RSI alcanzaba un valor superior a 70, se podía interpretar como que el activo estaba sobrecomprado y el especulador debía plantearse vender, mientras que si el RSI es menor a 30 indica una sobreventa, así que es el mejor momento para comprar.
The RSI (Relative Strength Index) is an indicator used in technical analysis, it is one of the easiest to interpret and reflects the relative strength of upward movements compared to downward movements. It was devised by J. Welles Wilder and according to his study he established that if the RSI reached a value above 70, it could be interpreted as meaning that the asset was overbought and the speculator should consider selling, while if the RSI is less than 30 it indicates oversold, so it is the best time to buy.
Veamos un ejemplo, aquí se encuentra la gráfica del par BTC/USDT en la aplicación web de Trading View, en la parte superior vemos las velas japonesas que indican el precio de apertura y de cierre, los máximos y los mínimos. Abajo he colocado el indicador RSI (índice de fuerza relativa), es otra gráfica, y tiene dos líneas horizontales punteadas en el 70 y en el 30, éstas serán los límites del RSI y si su valor se sale de esas líneas indicará una sobrecompra o sobreventa.
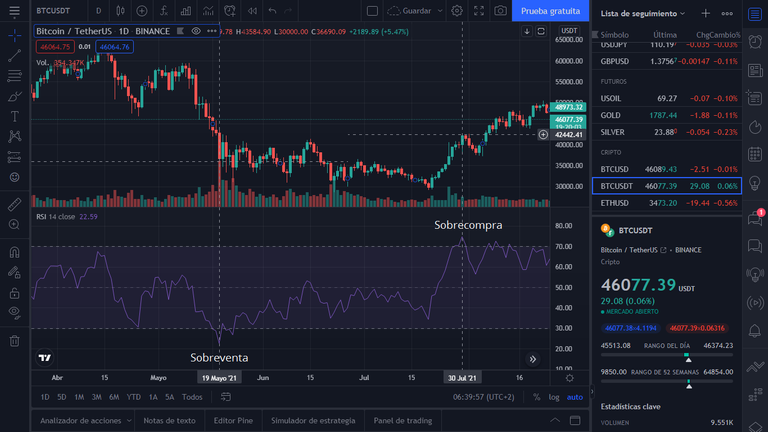
Let's see an example, here is the chart of the BTC/USDT pair in the Trading View web application, at the top we see the Japanese candles that indicate the opening and closing price, the highs and the lows. Below I have placed the RSI (relative strength index) indicator, it is another chart, and it has two dotted horizontal lines at 70 and 30, these will be the limits of the RSI and if its value goes out of those lines it will indicate an overbought or oversold.
Allí también he colocado dos líneas verticales punteadas, la línea de la izquierda se alinea con un mínimo del precio del Bitcoin, se vendió mucho en ese instante y el RSI se encontró por debajo de 30, esto confirma la sobreventa, el miedo, o la salida de algunos para obtener sus beneficios. Por otra parte, la línea de la derecha la vela japonesa alcanzó un nuevo máximo, y en ese mismo instante el RSI superó el valor de 70 (fuera de la línea horizontal), es decir, hubo una sobrecompra.
There I have also placed two dashed vertical lines, the left line aligns with a low of the Bitcoin price, there was a lot of selling at that instant and the RSI was found below 30, this confirms oversold, fear, or the exit of some to get their profits. On the other hand, the line on the right the Japanese candle reached a new high, and at that same instant the RSI exceeded the value of 70 (outside the horizontal line), that is, there was an overbought.
Por ejemplo, observen la siguiente tabla:
| minute | close price | Up | Down |
|---|---|---|---|
| 1 | 432.73 | - | - |
| 2 | 432.8 | 0.07 | - |
| 3 | 432.73 | - | 0.07 |
| 4 | 432.70 | - | 0.03 |
| 5 | 432.86 | 0.16 | - |
| 6 | 432.19 | - | 0.67 |
| 7 | 432.20 | 0.01 | - |
| 8 | 432.16 | - | 0.04 |
| 9 | 432.11 | - | 0.05 |
| 10 | 432.31 | 0.20 | - |
| 11 | 432.28 | - | 0.03 |
| 12 | 432.10 | - | 0.18 |
| 13 | 431.81 | - | 0.29 |
| 14 | 431.74 | - | 0.07 |
| 15 | 431.71 | - | 0.03 |
El RSI se calcula a partir de la diferencia entre el precio de cierre anterior y el precio de cierre actual reflejado en la vela. Si es superior al anterior, se coloca ese incremento en la columna de Up, si es menor se coloca en la columna de Down. Como pueden observar, en un periodo de 14 minutos, hay más valores en la columna de Down, ya da un indicio de que que la criptomoneda está sobre vendida. Luego se suman las columnas de Up y Down columna y se divide en un periodo de 14 minutos, si utilizan la gráfica de 1 día (1D) sería entre 14 días.
The RSI is calculated from the difference between the previous closing price and the current closing price reflected in the candlestick. If it is higher than the previous one, that increment is placed in the Up column, if it is lower, it is placed in the Down column. As you can see, in a period of 14 minutes, there are more values in the Down column, it already gives an indication that the cryptocurrency is oversold. Then the Up and Down columns are added together and divided in a period of 14 minutes, if you use the 1 day chart (1D) it would be between 14 days.
Se divide el promedio las subidas (Up) entre el promedio de las bajadas (Down) y se obtiene el factor RS, (fuerza relativa), se coloca en la primera fórmula y así se obtiene el RSI, este proceso es lo que automatizará el código, realizará esos cálculos y se tomará la decisión de comprar o vender.
You divide the average of the ups (Up) by the average of the downs (Down) and you get the RS factor, (relative strength), put it in the first formula and thus you get the RSI, this process is what will automate the code, it will perform these calculations and the decision to buy or sell will be made.
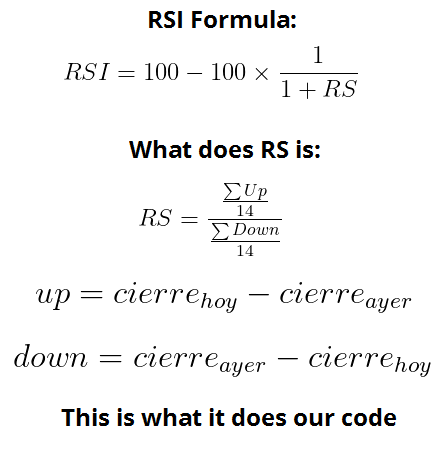
Por lo tanto, en el código, el valor calculado del RSI se comparará con nuestro límite de sobre compra, es decir, si éste es mayor a 70 se creará una orden de venta, utilizando la API de Binance, por el otro lado, si es menor a 30, se emitirá una orden de compra y en ambos casos, se enviará una petición HTTP a sus servidores.
Therefore, in the code, the calculated value of the RSI will be compared with our overbought limit, i.e. if it is greater than 70, a sell order will be created, using the Binance API, on the other hand, if it is less than 30, a buy order will be issued and in both cases, an HTTP request will be sent to their servers.
Es importante que en la variable TRADE_QUANTITY, tenga un valor que tu cuenta de Binance pueda manejar, es decir, que tu cuenta tenga fondos en el par elegido: TRADE_SYMBOL.
It is important that the
TRADE_QUANTITYvariable has a value that your Binance account can handle, that is, that your account has funds in the chosen pair:TRADE_SYMBOL.
Nota: Aunque el bot funciona perfectamente, está utilizando un solo indicador, el RSI, así que en algunos momentos puedes comprar en un mínimo, pero después viene otro mínimo más bajo, o que venda en un máximo y después venga un máximo mas alto, así que si quieres un bot más profesional, podemos agregarle más indicadores, más variables y la predicción de futuros valores.
En esa parte del código podremos agregar más lógica y utilizar otros indicadores financieros, ya que mientras más información se utilice se tendrán mejores resultados.
Recuerda: Cuando un mercado está en tendencia, es más probable que esta continúe en el tiempo y lo más importante es que hagas tu propia investigación.
Eso fue todo por hoy, espero que les haya gustado este tutorial. El código es relativamente sencillo, solo tienen que crear su clave de API y clave secreta en Binance, instalar los paquetes y copiar todo el código en un archivo index.py. La dificultad radica en las instalaciones, ya que pueden surgir errores de acuerdo a su sistema operativo, si todo está actualizado tal vez no pase nada.
Si quieren más instrucciones sobre lo que pueden hacer dentro de Binance pueden revisar su documentación.
¡Saludos y espero verlos pronto!
Enlaces relevantes:
Kline/Candlestick Data:
https://binance-docs.github.io/apidocs/spot/en/#kline-candlestick-data
Minimum trade amounts:
https://www.binance.com/es-LA/trade-rule
TA-Lib examples, documentation and all the indicators:
https://mrjbq7.github.io/ta-lib/
How to fix installing TA-Lib error:
https://stackoverflow.com/questions/53845708/trouble-installing-ta-lib-in-python-3-7
Tal vez tengas un error al instalar TA-Lib, depende de la arquitectura de tu PC x64 o x86, pero puedes ver cómo solucionarlo allí.
Maybe you've got an error installing TA-Lib it depends on your PC architecture x64 or x86, but you can see how to fix it there.
Disclaimer: Todas las imágenes mostradas son capturas de pantallas de mi proceso de codificación y los pasos a seguir dentro de Binance, a excepción de la imagen de las velas japonesas que fue creada en Figma.
Que información tan completa y detallada Luis Mario! @luis96xd
Hiciste casi que un mini curso 😊
Está pero excelente tu proyecto de automatización. 👍🏻👏🏻💪🏻😎
¡Muchas gracias por leer Betty! Me alegra que le haya gustado ¡Saludos!
The rewards earned on this comment will go directly to the person sharing the post on Twitter as long as they are registered with @poshtoken. Sign up at https://hiveposh.com.
Congratulations @luis96xd! You have completed the following achievement on the Hive blockchain and have been rewarded with new badge(s) :
Your next target is to reach 1500 upvotes.
You can view your badges on your board and compare yourself to others in the Ranking
If you no longer want to receive notifications, reply to this comment with the word
STOPCheck out the last post from @hivebuzz: