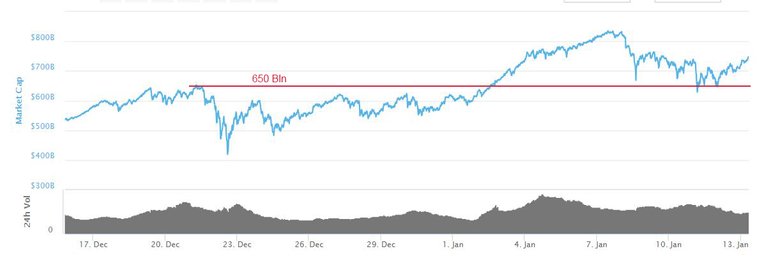
Before Christmas time the market fell sharply to just above 400 Bln, that caused alot of nervousness which can be seen on the chart as choppy movements sideways. Around Jan 2 index started to rise and did so until Jan 7 when we saw another sharp sell off. After the drop it has slipped lower gradually with another low on Jan 11 at 628 Bln. These bottoms is currently forming a support around 650 Bln which aligns well with the top on Dec 23. Thus we have a classic technical test of former resistance now turned support. The 650 Bln mark is the line in the sand for the bullish sentiment of market volume growth.
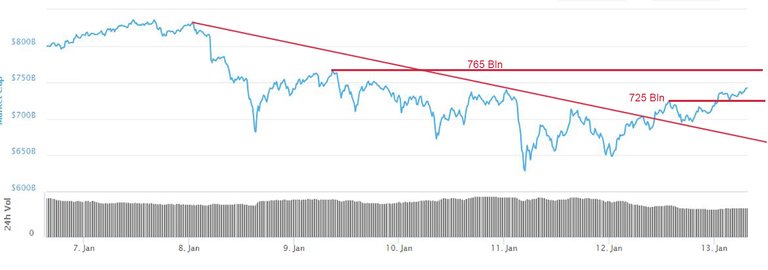
If we look at a close up of the last weeks movements we see how volume has broken above the trendline and came back to test it from above. It has since taken out the recent high at 725 Bln and come back to test it and now seems ready to advance and test the top at 765 Bln. Overall as long as volume stays above the 650 Bln mark, the market growth looks bullish. A sharp drop and taking out of the low at 628 Bln could accelerate the money outflow. The 725 Bln level is the intraday support.
Check out my crypto analyst channel for the latest technical news
https://www.tradingview.com/u/CapMoore/#published-charts

