
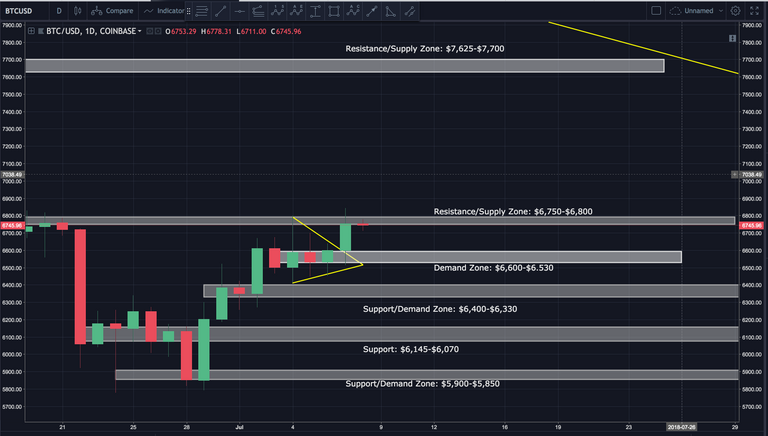
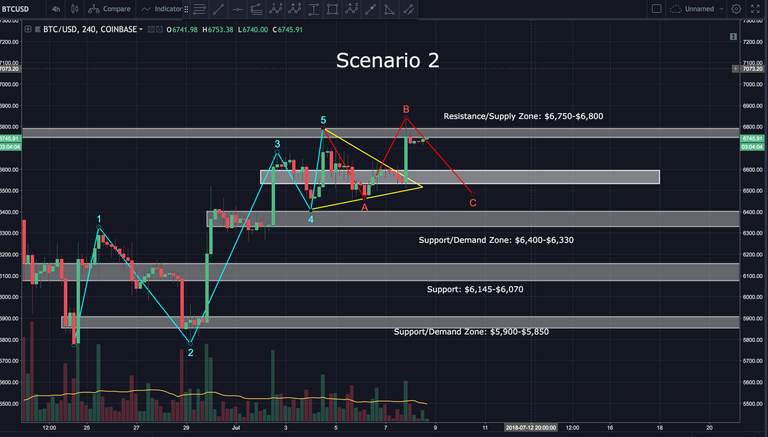
Yesterday bitcoin had a bullish break up to test the $6,800 supply/resistance zone. It was able to break through by a wick, before being quickly rejected by the bears. Please watch video analysis at the bottom of this article for much more detail.
If bitcoin can decisively break above $6,800, there’s not much resistance until $7,625-$7,700. To the down side, there’s a descent demand/support zone between $6,600-$6,530. I wouldn’t be surprised to see a drop to that level before another attempt up to break the $6,800 resistance.
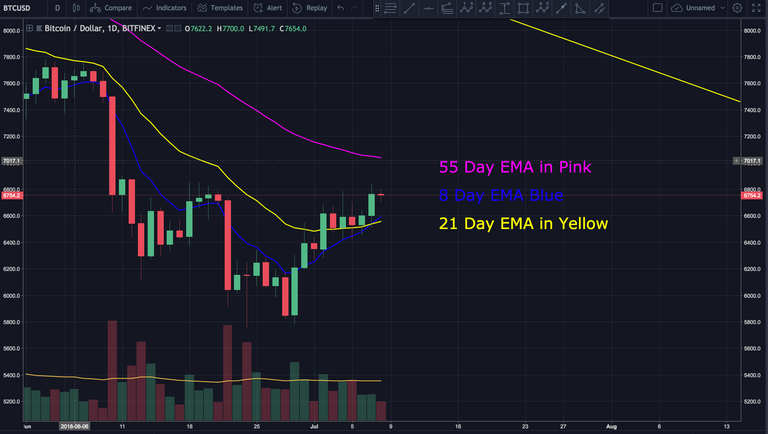
Looking at the daily chart, we can see the 8 day EMA just barely crossed above the 21 day. This is a bullish sign...especially if it can remain there. Price was sitting on top of the 21 day EMA for the last few days. Ideally we’d like to see price rise above the 55 day EMA this coming week.
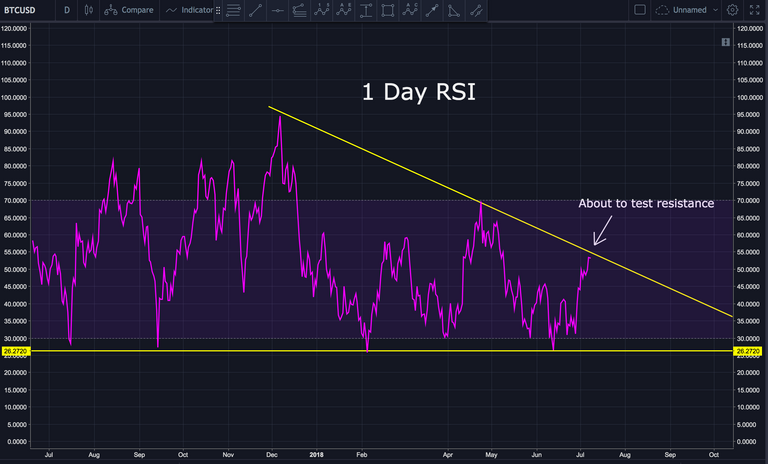
The 1 day RSI is about to test the descending resistance line. A break above would be a very bullish indication.
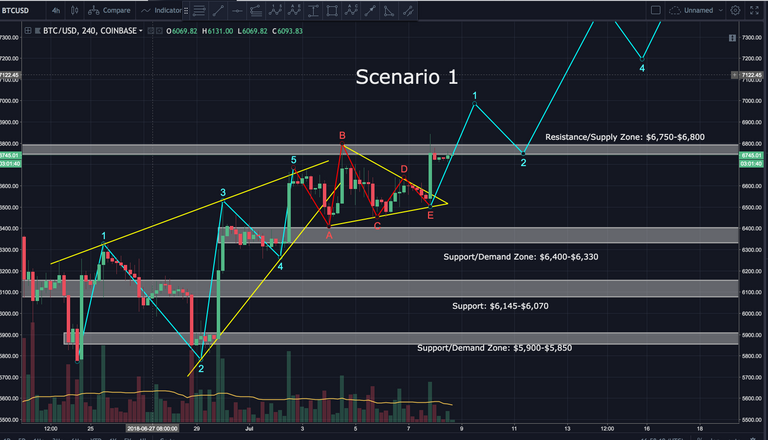
My primary count has bitcoin just completing an ABCDE correction from a leading diagonal. If correct, it’s now entering 5 impulse waves up.
Scenario 2 has bitcoin in an ABC correction, with wave C just beginning.
Please watch the below video analysis for MUCH more detail not included above.
Video Analysis:
Let’s see how the next 24-48 hours unfold.
BIAS:
Short Term: Slightly Bullish
Longterm: Very Bullish
I hope this has been helpful. I’d be happy to answer any questions in the comment section below. Until next time, wishing you safe and profitable trading!
Workin
If you found this post informative, please:

If you don’t have an account on Binance, I STRONGLY recommend getting one. They’re usually the first to get reputable coins, have excellent security and second to none customer service. Sign up here free of charge: https://www.binance.com/?ref=16878853
Brave is one of the safest, ad free browsers ever created. It helps support the crypto ecosystem by awarding content providers with BAT tokens. Join the revolution and download the latest version here: https://brave.com/wor485
Follow me on Twitter (handle is @Workin2005) and Facebook to receive the latest updates. https://www.facebook.com/Workin2005
Published on

by Workin2005

Volumes are lower than I would like to see and probably what is needed to push prices past resistance. However, if past we could probably see a squeeze much higher due to some stops that may be above.
As stated in the above video, this rally looks very weak and unsustainable UNLESS we see a major increase in volume in a relatively short amount of time.
wow realy good..
Thanks @binoy2018
Nice analysis, if we can break the $6800 level price has a chance of moving higher.
Thanks @rollandthomas. Yep...$6,800 is the short term goal. Above that, we need to take out $7,700 before I'll be convinced this uptrend is sustainable.
I vote for Scenario 1 :P
Me too.
Only if we understand, can we care. Only if we care, we will help. Only if we help, we shall be saved. ― Jane Goodall