Making Crypto Buy/Sell Decisions
Bitcoin
Every rule or advice you learned about investing applies to cryptocoins. Ill timed buying can give you an immediate loss which may cause a paniced exit or lock you in with a paper loss while you wait for the market to come back. Technical techniques apply too. You can see some of these technical tools while reading many of the cryptocoin analysis posts on Steemit.
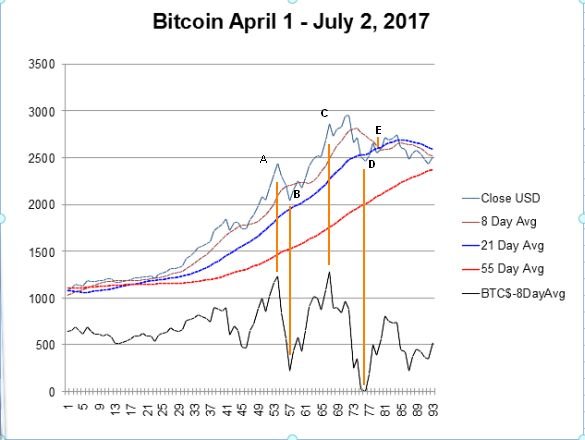
I noticed something while checking a price chart with a moving average. The typical sell point is either when the price crosses the moving average or when a short period moving average crosses a longer period average. There's no question that these crossings indicate a possible change in direction. But, what if you could arrive at the same sell decision a few days to a week earlier? What I propose is to subtract the shortest moving average from the price. Here is an example of how this could work.
The following Bitcoin chart covers the period April 1 to July 2nd. There are 3 moving averages, 8 day, 21 day & 55 day.

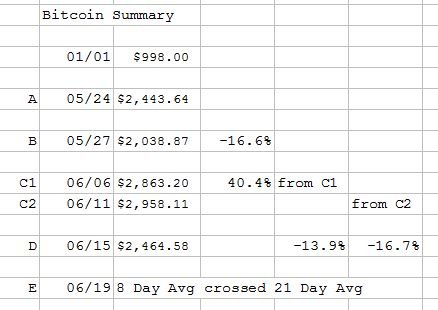
The black line at the bottom is the difference of Bitcoin close price minus the 8 day average. I adjusted the values to shift negatives values above 0. In the chart, the orange lines point to the Bitcoin price. Point E points to a crossover of the 8 day to below the 21 day. This is a short term decline within the rising 55 day average. From a forecast point of view, Bitcoin could go up forcing the 8 day average back above the 21 day, or it could decline and eventually force the 8 day average below the 55 day average. Here's a summary.

Litecoin
Here is a chart of Litecoin from April 1 to July 2nd using the same moving averages and price difference from 8 day moving average. Quite often you will see a 20 day and 200 day moving average. There's nothing sacred about the 20/200 day average vs other choices. The primary rule is to use an average that doesn't trip buy/sell decisions too frequently. In my case The numbers are Fibonacci numbers.

At points A & E there were two potential choices for the high. It is easy in an analysis made weeks later to pick the higher of the two. But, be honest, cover up the right portion of the chart and look only at the first high. If that's all you had to look at, would you have sold? Here's a summary for Litecoin.

Now, a final word about selling. You could sell all Litecoins and reinvest those funds on a buy signal, or only sell a portion, like 25%-50%. Use numbers you are comfortable with for your moving averages and what percentage of your holdings to sell.
There is a strong voice for buy and hold, but I prefer to have a way to know when to sell. In the case of the Litecoin chart above, a buy and hold from Jan 1st to July 2nd would have seen a gain of 1,027%. While selling and reinvesting at the points shown above could have compounded the investment to a 23,977% gain.
Please vote and follow @toadslinger
Interesting post and analysis thanks. I think there could well be a drop in the price of Bitcoin. On the daily chart, a head and shoulders pattern has formed. It can be seen in your chart though is better seen with candlestick charts. They are my preferred way at viewing price action.
Will the pattern play out or will it fail? Hasn't really given a clear indication of which way it will be headed. I wrote a post about it Crypto Charts Analysis #1 Bitcoin 4th July 2017
Altcoins are draging it alot. Look for market cap percentage graph