Disclaimer: Remember that the contents of this blog ought to be taken with a grain of salt! I am a beginner when it comes to Technical Analysis - I have a lot to learn. Therefore, buying or selling actions should not be taken in light of my analyses (nor should another's analyses dictate your buying or selling actions). Always DYOR (do your own research) and make decisions that you and you alone are responsible for.
Let's get into it!
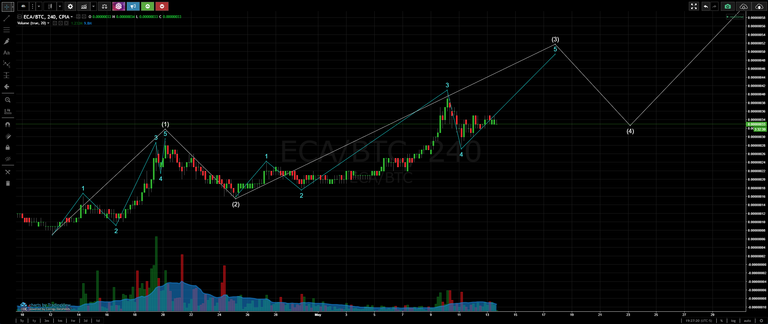
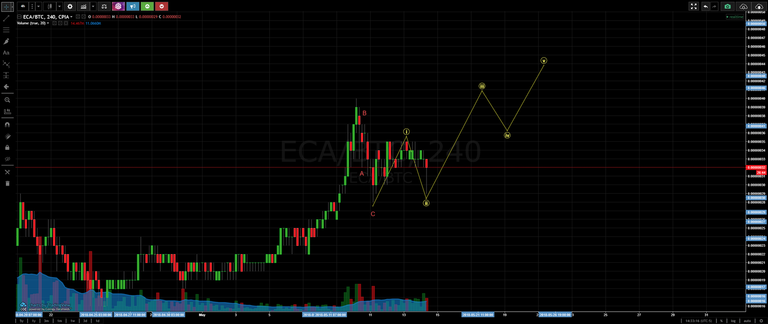
Firstly, let's check out the charts below from my blog post two days ago:


You can see my tentative counts in the charts above. Although, given that price action has dipped below the prior low of 28 sats that was hit on May 11th, I want to propose an adjusted count. Instead of our recent high of 40 sats representing the top of minor-degree wave 3, perhaps the correct top of minor-degree wave 3 was 37 sats, which would therefore mean the bottom of minor-degree wave 4 is 32 sats, and the top of minor-degree wave 5 is 40 sats. You can see what I mean in the chart below:

Let's check out how this adjustment could then fit into the bigger picture:

IF this adjusted analysis is correct, there are quite a few implications to consider. That would mean that we are now on wave 4 of 5. Once we have found the bottom of wave 4, we will begin wave 5. If you have been keeping up with my posts, you'll know that an over-extended wave 5 has already been seriously considered! IF this analysis here is correct, then that means the top of our higher-degree wave 3 is grossly under the minimum for a third wave (1.62x wave 1, or 52 sats), which would certainly hint at the idea of an over-extended wave 5. Further, if we are currently on a higher-degree wave 4 retracement, we could potentially (hopefully) be seeing a bottom soon. Why do I think so? Firstly, this correction we have been in has taken about the same time as the last major correction we saw (higher-degree wave 2), which is not necessarily a prerequisite. Secondly, check out the chart below, where you'll see a requisite three waves down (represented by a red ABC), in addition to a Fibonacci retracement guide showing that we are nearing a 61.8% retracement of our higher-degree wave 3.

I feel confident saying that we are on wave 4 of a higher degree of trend. Which means that at the bottom of wave 4, we will begin our wave 5...
Given that higher-degree wave 3 was quite under-extended (only 1.09x the length of wave 1), I fully expect wave 5 to be over-extended. Let's consider where we could be heading with the current values:

There are ways to estimate which of the three above scenarios are most likely, though I won't discuss those methods here. Once wave 5 begins, we can add to our confidence that wave 5 may over-extend itself if we see a volume increase to a level that exceeds that of waves 1 and 3.
Finally, check out the MACD:

Looks to me like the sellers have gotten ahead of themselves and have brought Electra to a level that is quite over-sold. The MACD is now beginning to curl upwards...is now the time to be taking buying or selling actions?...And what about when we find the top of our higher-degree wave 5? If we have an over-extended wave 5, don't walk, but RUN away.
I hope this has been helpful and educative for you.
Cheers!
Legal Disclaimer: I am not a financial advisor nor is any content in this article presented as financial advice. The information provided in this blog post and any other posts that I make and any accompanying material is for informational purposes only. It should not be considered financial or investment advice of any kind. One should consult with a financial or investment professional to determine what may be best for your individual needs. Plain English: This is only my opinion, make of it what you wish. What does this mean? It means it's not advice nor recommendation to either buy or sell anything! It's only meant for use as informative or entertainment purposes.