The article in a nutshell
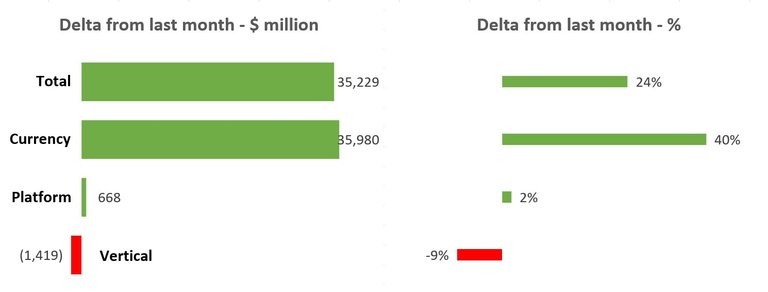
The October/2017 update of the The Crypto Assets Map reflects the significant growth in market cap during the month - $35 billion growth, or 24%, reaching a total of $. However, this growth originated in the Currency vector, whilst platforms shows a modest growth and Verticals, a reduction. If you want to understand what The Crypto Assets Map is and why it was created, I recommend reading the article that introduced it. Feel free to share The Crypto Assets Map – but remember: this is not investment advice and is provided as-is, without any guarantee about its correctness nor its adequacy to make investment decisions
Disclaimer: this is not investment advice and I am not your financial advisor. You are the only responsible for making the due diligence of any asset you are interested in investing and the only responsible for this decision. In no event I hold any accountability for your own investment decisions. This information is provided as-is, without any guarantee about its correctness nor its adequacy to make investment decisions.
The October/2017 update
It is never boring in the cryptoverse, and last month was not an exception. Heavily influenced by the Bitcoin Gold fork and the (then) looming SegWit2x fork, there was significant shift in value across the vectors we defined. Currencies – in reality Bitcoin – captured almost the entirety of market value growth during the month in terms of value.
The churn rate in the top 100 was significant, with 14 crypto assets replaced. The following assets dropped from the top 100:
• Aidos Kuneen
• Centra
• CloakCoin
• Cofound.it
• Elastic
• FirstCoin
• Gulden
• Melon
• MobileGo
• Pillar
• Rise
• Storj
• TokenCard
• Wings
Replaced by:
• ATMChain
• Bitqy
• Cardano
• Groestlcoin
• Loopring
• Metaverse ETP
• MonaCoin
• Neblio
• NoLimitCoin
• Pura
• SmartCash
• TaaS
• TRON
• VeChain
In terms of value, the graphs below summarize the changes from last month. It is easy to see how growth concentrated only in the Currencies vector – in fact, only Bitcoin represents 98% of this shift, effectively capturing value from other assets (most clearly from the Verticals vector).

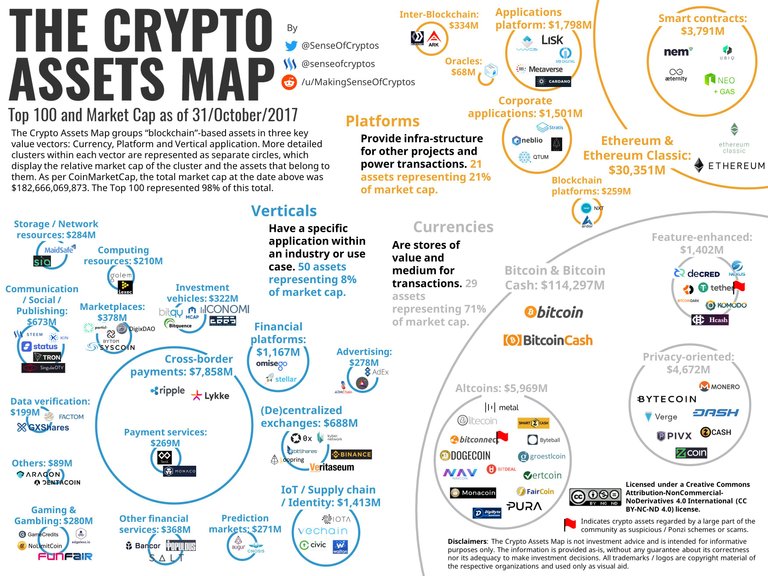
During the past month it also became visible that some crypto assets are being increasingly denounced as clear Ponzi schemes or scams. This created somewhat of a dilemma for this author. On the one hand, I started this project with the intent of creating an objective, asset-agnostic source of information – hence the use of new accounts instead of my regular accounts, to keep it separate from all other discussions I might have online or offline. Following this rationale, I did not want to simply remove these assets – after all, they are listed within the top 100 crypto assets in the data source I selected. On the other hand, I believe that naïve / uninformed investors deserve to be alerted against the possibility of taking more risks they would be willing to. The solution to this conundrum was to add a ‘red flag’ to the assets in the Crypto Assets Map that are consistently being denounced, given that there are reasonable arguments sustaining this. Bear in mind that having no ‘red flag’ does not mean that I endorse the asset - you should err on the side of caution and assume that being in the top 100 tells one nothing about the relevance of the use case, its market potential, competence of the team behind the project, quality of the code developed, maturity of the technology adopted or the community’s ability to steer decisions.
With no further ado, here is the October/2017 update of The Crypto Assets Map:

Final words
My idea is to release these updates monthly, possibly with some follow up posts with more details about the changes from previous month. I would love to know your thoughts and which insights you might have gotten from it.
Completing The Crypto Assets Map took a significant effort. I would like to know whether you found it valuable - so please upvote in case you got value from it and would be interested in updates and other analyses.