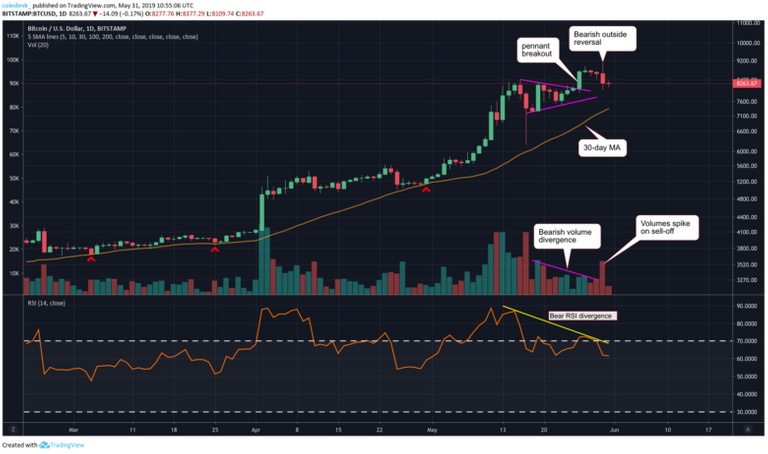
On Thursday, May 30, the price of Bitcoin overcame the mark of $ 9000, updating the annual maximum, but then a rapid correction began. As a result, the first cryptocurrency lost in the order of 5%, the decline stopped in the region of $ 8,200- $ 8,300. Nevertheless, bears can push the price up to a 30-day MA at $ 7342.
June is traditionally a favorable period for Bitcoin (five of the last seven years), but the technical picture shows a bearish divergence, and a fall of $ 1100 after reaching the annual record formed a red reversal candle on the daily chart. If the price really goes below the 30-day MA, then the growth in June will be under threat.

Such a strong correction on the daily chart may indicate the beginning of a reversal of the trend to bearish, especially after a long rally. In such a situation, traders usually focus on closing below the previous daily low to confirm the trend, Godboul writes. In his opinion, a fall to the 30-day MA will become more likely if the daily UTC candle closes below $ 8000.

The RSI indicator once again formed a bearish divergence with quotes and trading volumes.