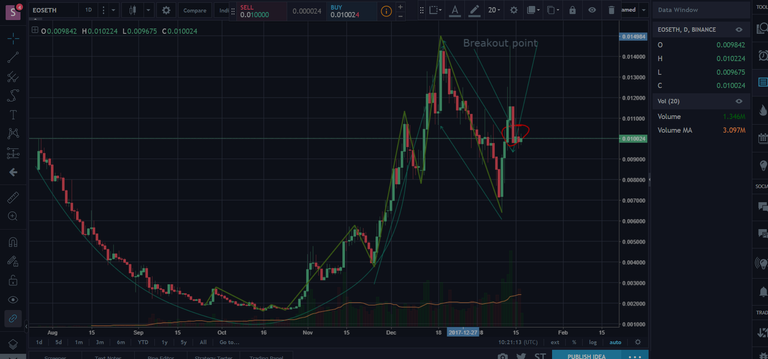
Hello traders! Take a look at this (EOS/ETH chart! The Cup & Handle pattern is uncanny. The cup can actually be subdivided into two smaller rounded bottoms. The handle is formed and complete as marked by the blue lines.
- A cup: A cup formation happens when the price moving in a uptrend shows a pull back followed by a consolidation period which makes the bottom of the cup and finally the reverse back to upside continuing the uptrend. Usually in cup formation it makes equal highs at the corner of the cup with the intermediate price ranges such that it will take a Bottom of a cup which serves as support for the pattern as shown in the figure. Usually the pattern looks like a 'U' to round bottom. The duration for the formation of a cup is usually from one month to several months. The cup should be considered reliable only when it is less then half percentage of the preceding trend.The deeper the 'U' or round shape the reliable the pattern is.
Cup And Handle Chart Pattern Sample Example
.png)
- A handle: After the formation of right highs of a round cup, there is a pull back before continuation of the trend which forms the handle of this pattern. It is formed in the right hand side of the cup. The duration for the formation of a handle is usually from 1 week to several weeks. The handle should be considered reliable only when it is formed in the top half of the cup formed as shown in the figure.
Important Characteristics of Cup and Handle Pattern:
Trend: Cup and Handle Pattern is considered as a continuation pattern only, when there is prior trend before the formation of this pattern.
Duration: Cup and Handle Pattern is considered as a long term continuation pattern. It takes one month to several months for the formation of a cup followed by a handle which takes about 1 week to several weeks.
Breakout: It is very important for the confirmation of this pattern. A breakout is supported by huge volumes. Breakout is the confirmation of this pattern that the previous trend has resumed.
Volume: As the pattern proceeds the volume start contracting followed by an increase in volume activity on the breakout above the handle's resistance. Volume plays a vital role in confirming the patterns.
Price Target: One can roughly place a price target after a breakout, and it should be the estimated by measuring the distance from the right peak of the cup to the bottom of the cup, however other indicators have to considered as well like MACD, RSI, etc.
Precautions Taken while considering Cup And Handle Chart Pattern
1.Study based on one Chart Patterns sometimes gives false signals and proved to be very dangerous. Therefore its always advisable to incorporate other technical study like Volume, RSI etc for reconfirmation.
2.Always use a stoploss, its the best strategy to maximize your profit and minimize losses.
Hi! I am a robot. I just upvoted you! I found similar content that readers might be interested in:
http://tutorials.topstockresearch.com/ChartPatterns/CupAndHandle/TutorialsOnCupAndHandleChartPattern.html