Hello fellow traders and investors!
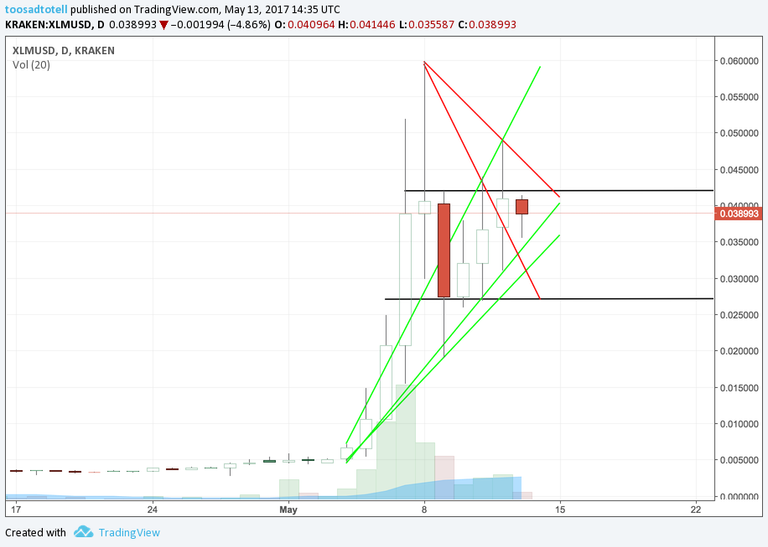
Here is my little intuitive technical analysis graph for Stellat Lumens XLM, and where it might be heading coming days.
I'm not a professional trader , just learning about basics and playing with the concepts.
So basically i'm playing with the support channel trends in green and the bearish channel trends in red. The black lines are the support/resistance levels in the horizontal channel where we see a bit of consolidation in price. I believe the next clear break out level will be above 0.041
Your thoughts and comments are welcomed of course, as i might learn from them.
Cheers @quantumevolution