Bitcoin ₹489,000
Bitcoin, Ethereum, Bitcoin Cash, Ripple and Litecoin : Price Analysis, 2nd Week- 13th July
Bitcoin, Ethereum, Bitcoin Cash, Ripple and Litecoin : Price Analysis, 2nd Week- 13th July

“A peak performance trader is totally committed to being the best and doing whatever it takes to be the best. He feels totally responsible for whatever happens and thus can learn from mistakes. These people typically have a working business plan for trading because they treat trading as a business.” – Van K. Tharp
The rising consolidation just above the recent low prices can be an indication that the cryptocurrency markets are preparing for creation of a bottom for the next bullish move. However the above can’t be validated given the rising acceptance for 2 weeks below the moving average indicators.
Tom Lee – Wall-Street strategist has given a price forecast for Bitcoin to be $20,000 by the end of 2018 on the theory of the cost of mining and rising difficulty over the same. On the other side, the Head of the Bank for International Settlements (BIS) continued the institution’s critical stance on cryptocurrency.
Pertaining to law – Malta passed three blockchain bills passing a regulatory framework and South Korea government drafts new blockchain classification standards. Whereas, RBI (Central Bank of India) has barred all regulatory body under it to support cryptocurrency dealings.
Having mentioned all of the above, it is very difficult to predict which side of the coin will be placed as results once the coin in flipped. Cryptocurrency markets have accumulated its own group of supporters and protesters around the globe but the fact to realise is – It has garnered enough attention to be form these groups. The rising awareness has brought all together rationality in cryptocurrency markets which is healthy for long-term objective.
Let’s look what we have in store for a trade set-up:
Bitcoin:
Weekly Bitcoin Technical Price Analysis
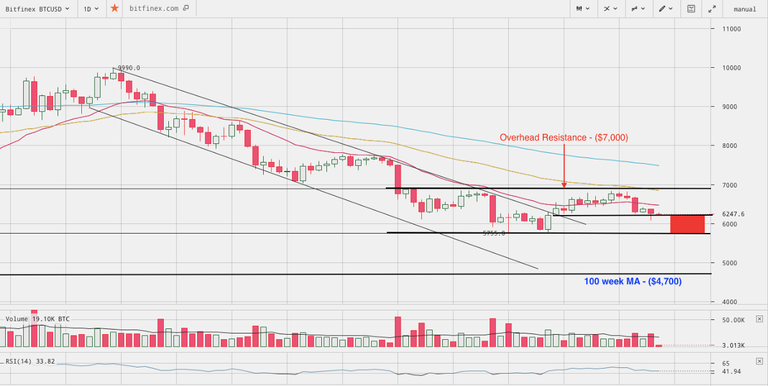
Bitcoin is representing a 0.2% gain in last 24-hours trading close to $6,250.
Bitcoin having moved over the descending channel and the 20 day EMA failed to gain further momentum and the rally got washed out in another week. Currently, Bitcoin has found acceptance below the 20-day EMA and the short-term overhead resistance of $6,500. The relative signal is bearish and Traders will have to wait for proper hints of reversal. BTC has exposed itself to testing lower levels of $6,000 and if that broken, can revisit newer lows.
The strongest of support lies between $5,350 and $4,700 with the latter being a stronger representing the 100-week MA. BTC in order to gain any mid-term bullish momentum has to crossover $7,000 resistance.
Ethereum:
Weekly Ethereum Technical Price Analysis
Ether is representing a gain of about 0.1% in last 24-hours and is trading around $435.
Ether despite invalidating the pull-back efforts have managed to defend its immediate support of $410 and thus, it shows subtle strength around the level. Having said above, ETH still looks under bearish zone with the flag-bearer cryptocurrency Bitcoin holding on lower levels. But any pull-back in BTC will instill more momentum in ETH.
At present, ETH will gain momentum only if the 20-day EMA is crossed over. On upper levels, ETH finds resistance at $485, $550 and $635 whereas on bottom side, the support lies at $410 and $355.
Bitcoin Cash:
Weekly Bitcoin Cash Technical Price Analysis
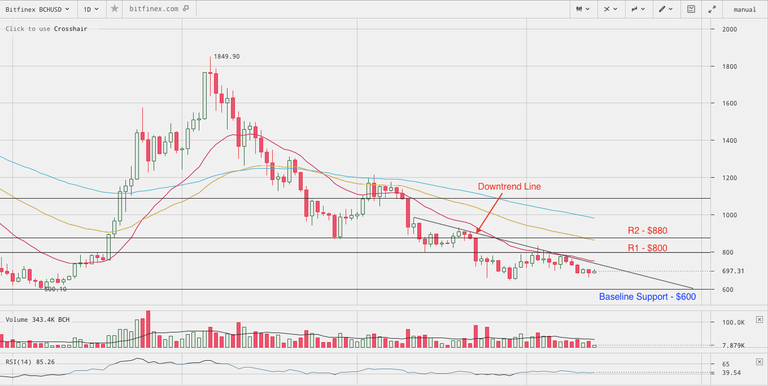
BCH is representing a gain of 2% in last 24-hours trading around $700 at the time of writing.
We have been mentioning in our previous analysis too that BCH has consistently shown signs of weakness with the cryptocurrency not even gaining advantage over its minor overhead resistance in short time-frames.
BCH still continues to face pressure on every pull-back attempt and only a cross over above $880 will instill investor and trader confidence in this asset. BCH has been known for its outrageous escalated momentum and so, a momentum above 20-day EMA close shouldn’t be avoided as well.
On lower side, BCH finds most important support only at $600 which if broken, will open up a fall probability of another 15% to $500 range.
Ripple:
Weekly Ripple Technical Price Analysis
XRP is representing a 1% gain in last 24-hour trading close to $0.44 at the time of writing.
XRP among all the major cryptocurrency pull-backs has failed to receive any attraction from investors and the relative asset could not gain access above its immediate important resistance of $0.56.
At present, XRP continues to face selling pressure and the given trend will reverse only if the mentioned resistance of $0.56 is crossed and closed above the same. An intraday resistance is formed around $0.50 which collides both with the downtrend line and 20-day EMA. On lower side the recent of $0.42 acts as supports which if broken, will expose XRP to test $0.34.
Litecoin:
Our analysis with LTC remains the same given in our previous analytical report. The short to mid term outlook is bearish unless the overhead resistance of $87 is crossed over.
Conclusion:
Bitcoin is slow rising in market dominance with present dominance around 43% of the overall cryptocurrency market. Given the high rate of correlation between Bitcoin and Altcoin prices, BTC would be the trend-setter in market. BTC currently is under bearish zone with respective supports being broken. A subtle support around $6,000 can be looked out for but if broken, will expose the respective asset down to $5,400 & $5,000. Short-term bias would go positive only if BTC crosses $6,450 for a momentum rally up to $7,000.
- S – Support , R – Resistance*
- EMA – Exponential Moving Average*
Weekly
Traders can smartly use their skills and can refer to the technical levels above to make optimised trade decisions. Happy Trading..!!
✅ @pewdiepiea, I gave you an upvote on your post! Please give me a follow and I will give you a follow in return and possible future votes! Thank you!
i gave u
give meback of yours