Bitcoin (BTC) price could create a major bullish technical pattern in the next few days, technical charts indicate.
It's a slightly confusing picture at the moment, however. The recent short-term bullish bias has been neutralized following BTC's close below (as per UTC) the 10-day moving average (MA) yesterday.
Further, the risk of a deeper pullback to $6,000 (February low and psychological support) look to have increased after Tuesday's 5.7 percent price drop.
However, that does not necessarily mean the bears are back in a commanding position, since the cryptocurrency is still holding well above the recent low of $5,755 (hit on June 24).
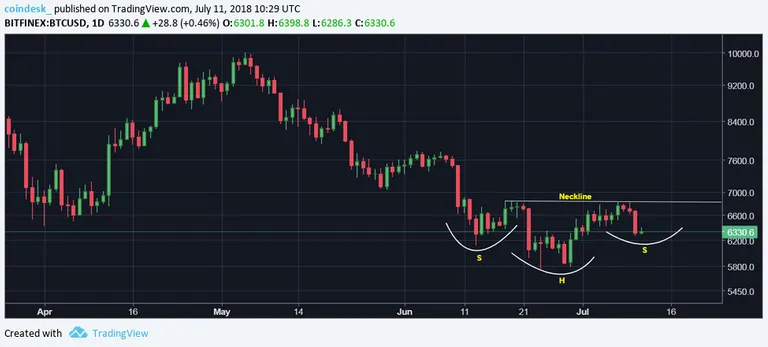
Notably, BTC could end up creating an inverse head-and-shoulders pattern (bullish pattern) soon if the bears fail to penetrate the immediate support of $6,000 in the next couple of days.
At press time, BTC is changing hands at $6,350 on Bitfinex – down 3.6 percent on a 24-hour basis.
Daily chart

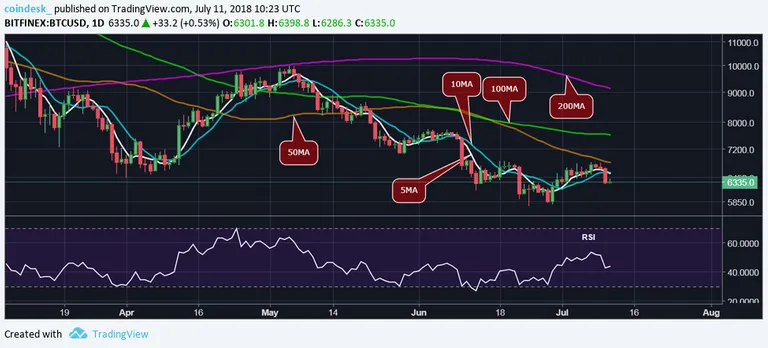
BTC's drop to $6,260 yesterday left another lower high (bearish pattern) on the daily chart, while the relative strength index (RSI) has rolled over in favor of the bears (is back below 50.00).
The 5-day and 10-day MAs are also beginning to slope downwards in favor of the bears.
The long-term MAs – 50, 100 and 200 – are located one below the other, indicating the path of least resistance is to the downside.
Thus, BTC looks set to test $6,000 in the next day or two. Acceptance below that level would expose the recent low of $5,755.
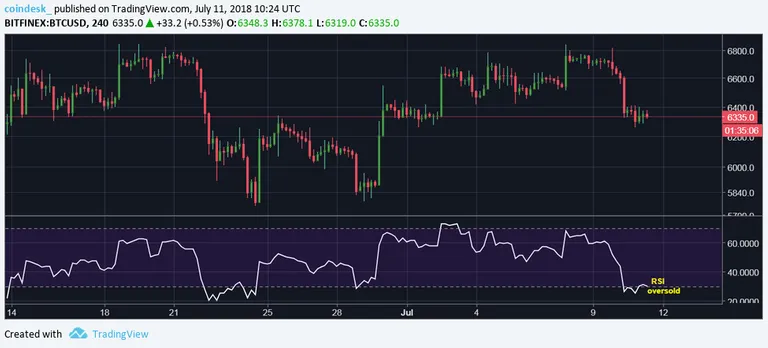
However, the short duration charts indicate BTC will likely defend the support at $6,000.
4-hour chart

The RSI is already reporting oversold conditions (below 30.00) and another $300 drop would only make it harder for the bears to push BTC below $6,000.
Hence, we are unable to rule out a rebound from $6,000 – a move which could end up creating the right shoulder of an inverse head-and-shoulders bullish reversal pattern, as seen in the chart below.
Daily chart: Potential inverse head-and-shoulders pattern

A long-term bull reversal (bear-to-bull trend change) would be confirmed if BTC bounces off the support at $6,000 and sees a high volume break above $6,832 (neckline resistance).
The probability of BTC completing the inverse head-and-shoulders pattern remains high as long as prices are holding above $6,000.
View
BTC's close below 10-day MA yesterday has neutralized the immediate bullish outlook.
The immediate support at $6,000 could be put to test in the next day or two, but the probability of a break below that level is low.
A high volume rebound from $6,000 would help BTC chart an inverse head-and-shoulders bullish reversal pattern.
A daily close (as per UTC) below $6,000 would boost the odds of a drop below $5,755 (June 24 low).
Hi! I am a robot. I just upvoted you! I found similar content that readers might be interested in:
http://criptocoinking.com/2018/07/11/bitcoins-price-may-be-charting-a-bull-reversal/