Now Bitcoin is positive and bullish. But this will be consistent?

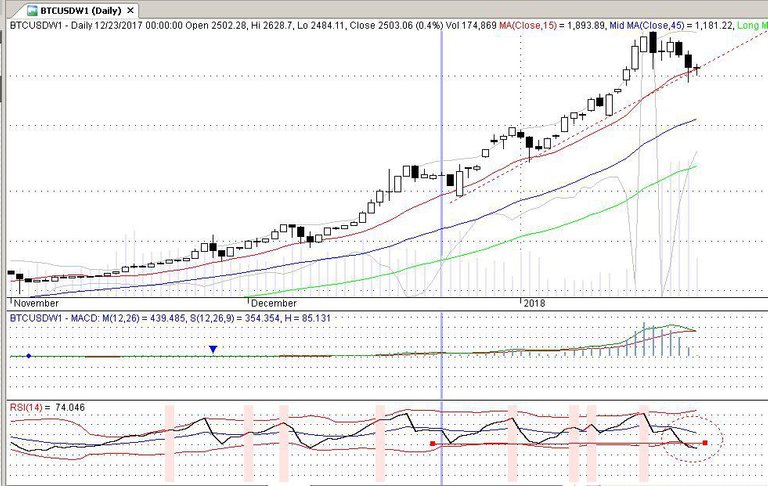
As you see in previous picture, Bitcoin react to low trend line of long channel and jumped above. But there was a real risk.
Be attention more carefully! As you watch, the support long RSI line is break down!!
I learn, long trend lines will be break down while the its RSI trend line is break down initially. That is a very important alarm!

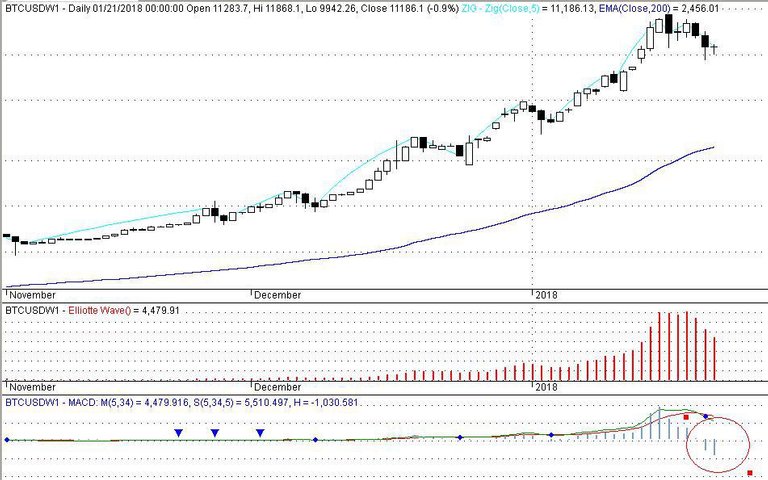
In previous image, You see the power of sellers in MACD indicator. As you see in weekly view sellers power is very high and not happened before these years of Bitcoin representation.

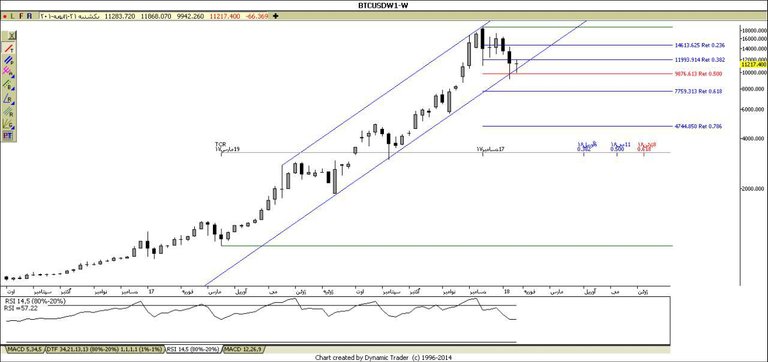
Now we suppose the long bullish wave of Bitcoin (in Elliot view) is finished and must be corrected. The crypto currencies often correct until 78.6% Fibonacci of wave. So as u see the target can be $4744 according to 78.6% Fibonacci of long bullish wave.

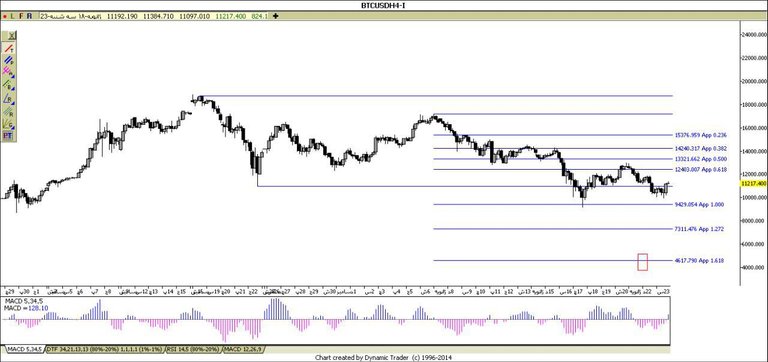
Now we analyse Bitcoin in H4 view, we try to analyse daily waves. If Bitcoin chart suppose to have ABC in Elliot analysis, it can correct until 161.8% Fibonacci extension of previous bearish wave. The target is matched to previous target: $4617
Disclaimer: This technical analysis is one of possible views to Bitcoin chart. There aren't any warranty that this view will happen 100%. It's only probable not more.
Please acknowledge me of your opinions with comments and up-vote
Sincerely
nobody knows what will happen in the future
Thank Roozbeh for your idea, I think u aren't familiar with technical analysis or elliot waves, you're right this senario is one of the between many senarios that can be happen! But I say something wierd to u honestly, Elliot waves in long term can predict future!!!! 😧😨 I can predict result of president election result ov iran and ............
:-) pls tell me now the result of the president election in iran ...