Following on from my article on continuation patterns, I'm now going to take a look at the number of reversal patterns to look out for in your technical analysis which, as the name suggests, can help you predict the reversal of price movement.
Head and Shoulders

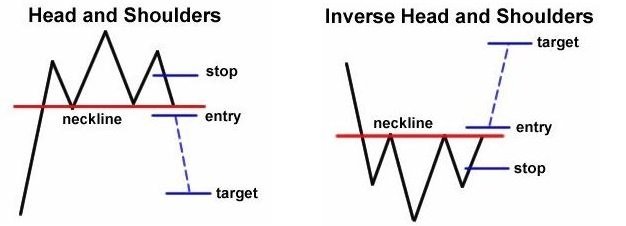
The Head and Shoulders indicates that the current uptrend is going towards a reversal to the down trend, while the Inverse Head and Shoulders suggest the opposite, a switch back from a down trend to an up trend. This pattern must consist of 3 peaks, with the largest of the 3 in the middle. Connecting the troughs of each peak forms the neckline, which once broken indicates a breakout and a further movement of the price in that direction.
An approximate rule commonly used is one that suggests, in the case of a Head and Shoulders pattern, the difference between the highest peak and the neckline is the amount that the price may fall after breakout. For example, if the neckline is at $100 and the highest peak is at $120, a price drop to $80 is predicted.
Double Top and Double Bottom

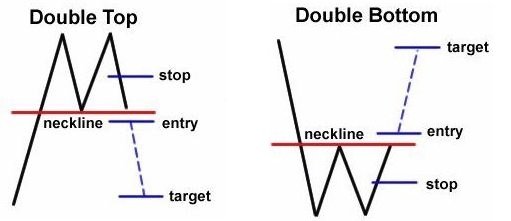
A Double Top is where, on an up trend, the price has made 2 attempts at breaking a certain resistance level, but failed to do so each time and therefore is usually followed by a reversal to the downward trend. The opposite is true for the Double Bottom. A neckline can again be drawn indicating a breakout has been completed if the price were to move below the pullback low for a Double Top, and above the pullback high for a Double Bottom.
Wedges

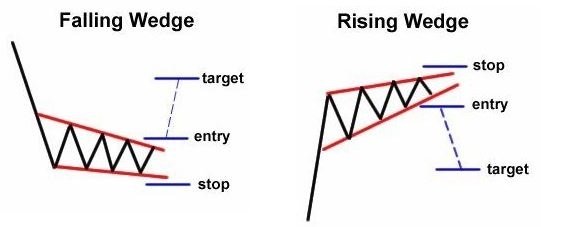
As explained in my previous article about Continuation Patterns, Falling or Rising Wedges can indicate both a reversal or continuation pattern depending on if they occur on an up trend or a down trend.
A Falling Wedge on a down trend is a good indication of a reversal in price movement. A resistance line that is reducing faster than the support line is a bullish pattern that can see the price breakout upwards as the wedge expires. Inversely, a Rising Wedge in an up trend is a bearish indicator that a downtrend is potentially on it's way.
As always, plot your patterns and watch for the confirmed breakout from that pattern. Don't FOMO buy within a pattern, be patient and wait for the confirmation.
Thanks, very interesting, keeps following you
You're welcome. I'm trying to simplify some of the key aspects of Technical Analysis and trading to aid beginners coming into the space. I have more similar articles coming. Thanks