Within three weeks of splitting into two, the Bitcoin community looks to be heading towards another split in November. This news has put brakes on the Bitcoin rally and there is a move away from the leader to other altcoins. As a result, Bitcoin’s dominance is down to 45.6 percent, from over 50 percent just a few days back, according to CoinMarketCap.
So, will Bitcoin continue to fall? Let’s analyze the charts and find out.
BTC/USD
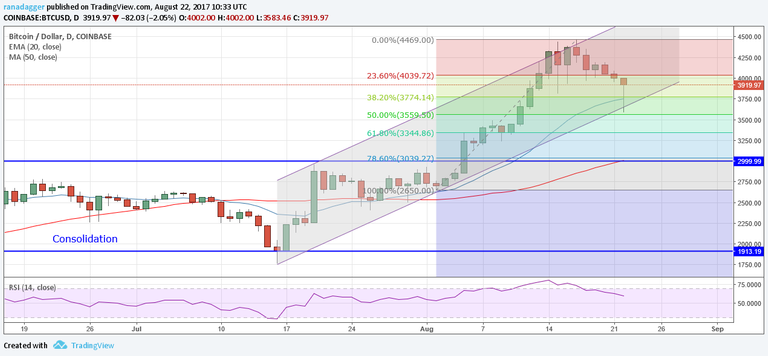
Following consecutive closes above $4000, we were expecting a breakout and close above the channel, which never happened. Nevertheless, our second scenario of a fall to the lower end of the channel did play out according to our expectations.

In doing so, Bitcoin completed a 50 percent Fibonacci retracement of its recent rise from the lows of $2650 to the highs of $4469. The pullback from the dual support of the channel line and the critical Fibonacci level shows that the bulls are still active at lower levels.
However, we don’t find an attractive buy setup at the current levels. The risk-reward is not in favor of the bulls. Though a trade can be taken above the $4000 levels, the stop loss is way deep at $3550 and the initial profit objective is only a retest of the highs at $4469. Due to a large stop loss, we are not advising any buy on the digital currency today.
Bitcoin remains bullish as long as it trades in the uptrending channel and above the 20-day exponential moving average and the 50-day simple moving average.
The first sign of trouble for the bulls will be when price breaks down and closes below the channel. It will then signal a fall to $3000 levels.
ETH/USD
Ethereum broke out of the critical resistance of $323 on Monday, however, it could not sustain the rise and closed just below the resistance at $322.

Traders, who went long at $330 levels might want to keep their stops just below the trendline at $280. A breakdown from the trendline and the 20-day EMA at $285 can push Ethereum down to the 50-day SMA at around $245 levels. However, if the bulls again manage to push the digital currency back above the overhead resistance, it will signal underlying strength, which should result in an upside to $381 and thereafter to $400 levels.
Traders with a lower risk appetite can close their position if the next attempt to breakout above $323 levels fails and the digital currency again reverses its direction lower.
BCH/USD
We got Bitcoin Cash right on two occasions. Hopefully, our readers were able to cash in their huge profits.

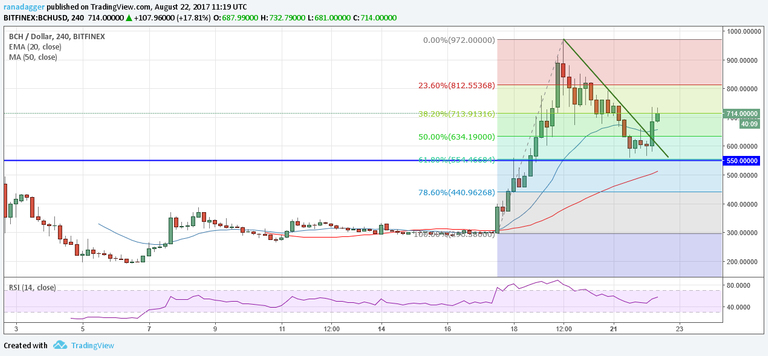
Now, after the stellar rise from $296.38 to $972, Bitcoin Cash pulled back close to 61.8 percent Fibonacci retracement levels where it found support. Since then, the currency has resumed its uptrend.
However, we expect to see some range bound action for the next few days. Hence, we shall not chase the price higher. If the price corrects again and successfully retests the $550 levels, traders can initiate long positions with a stop loss just below $550 levels.
The first target on the upside is $765, which is 50 percent Fibonacci retracement of the fall from the high of $972 to the lows of $558.6.
At current levels, the risk-reward is not in favor of the bulls, therefore we want to enter on dips when the risk is lower.
XRP/USD
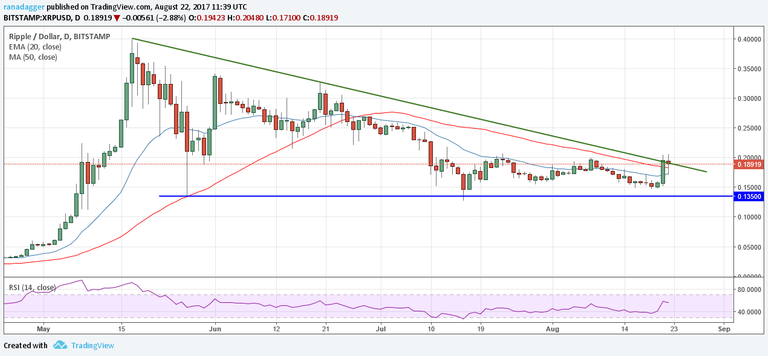
After days of low volatility, Ripple is finally showing signs of action. It attempted to breakout of the downtrend line both yesterday and today, however, it could not close above our buy level of $0.2000. We, however, should maintain our buy on a close above $0.2000 because that will invalidate the bearish descending triangle pattern. A failure of a bearish pattern is a bullish sign.

The stop loss for the trade is well-defined at $0.1260, a level not touched since May 9 of this year. Traders can expect a rise to $0.2500 initially and thereafter to $0.3250 levels. However, this is a risky trade as we are buying in a downtrend, in anticipation of a change in trend. Therefore, please be careful and try keeping the allocation size small.
LTC/USD
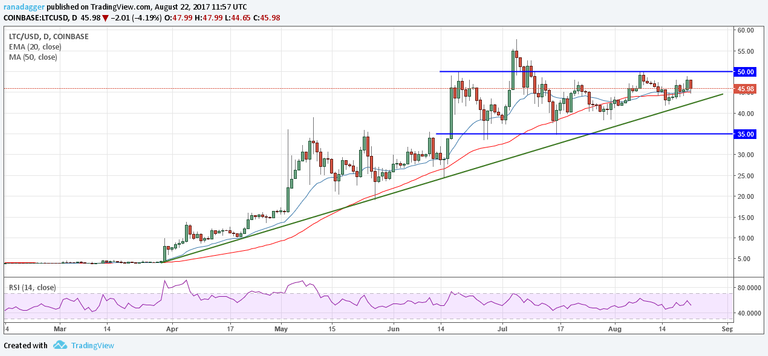
Litecoin has been range bound between $35 on the lower end and $50 on the upper end since mid-June of this year. Though it broke out of the range on July 4, it could not sustain the rally and fell back into the range.

However, if the price again breaks out of $50 levels, we expect the uptrend to resume, which has a pattern target of $65.
On the other hand, a breakdown below the trendline, can push the cryptocurrency back to the lower end of the channel. There is no trade within the range. Therefore, traders should initiate a trade only on a breakout above the overhead resistance of $50.
Hi! I am a robot. I just upvoted you! I found similar content that readers might be interested in:
https://cointelegraph.com/news/bitcoin-ethereum-bitcoin-cash-ripple-litecoin-price-analysis-august-22
Very good post. I was about to post a similair thread. The cryptospace definitely feels a bit inflated. However we also said that about the S&P 500 40 years ago I found this amazing platform: https://www.coincheckup.com This site is really helpful in my coin research. I don't know any other sites with so much indepth analysis.