Taking a look into BTC and where it is going. This forecast is going to be projecting up to 8/10/18.
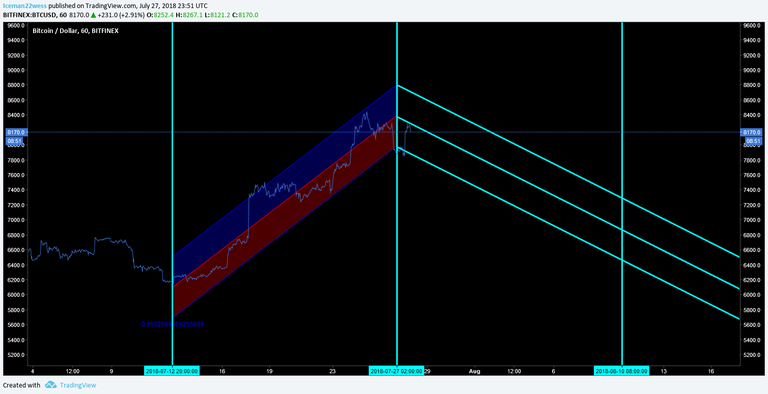
Here is our Volume correction base chart. These lines show a correction in volume, but in no way signal where the price is actually going. This is simply the template to build off of.

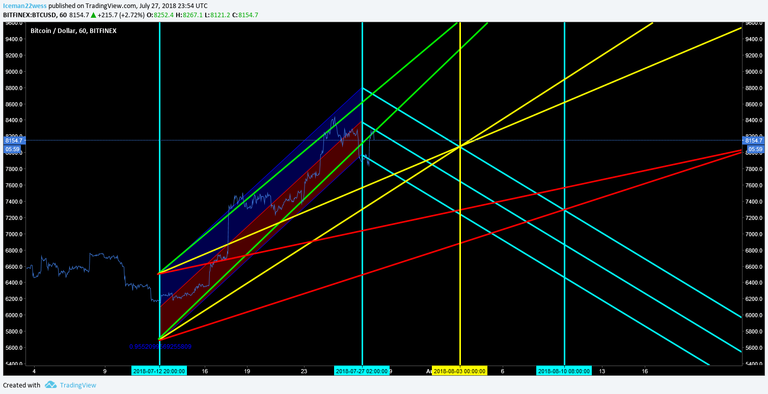
The idea here is crossing two fib level against each other and the crossing points become signals in time, which happens to be the holy grail I was searching for.
If I apply this to this chart it looks like this:

There is no green or red cross. This isn't good or bad, but this particular chart predicts a trend direction change on 8/3. This means that if we were to trade down all the way there, we would likely pump again, or if we trade sideways or up, we would fall right there on the 3rd.
The other thing about this chart is the 3 blue lines show me what direction the two yellow lines will break. I call the yellow lines, the break line. Since the blue lines are pointing down, this means that before we reach 8-10, the price should be below the yellow lines. This instantly creates a max top at 8900, anything higher is completely unsustainable. Keep in mind this is only valid until the 10th so this isn't a bearish call. It just means we shouldn't be able to break 8900 for quite some time.
So basically the idea here is to watch what the price does until the 3rd, in which case you would expect a reversal in direction to the 10th.
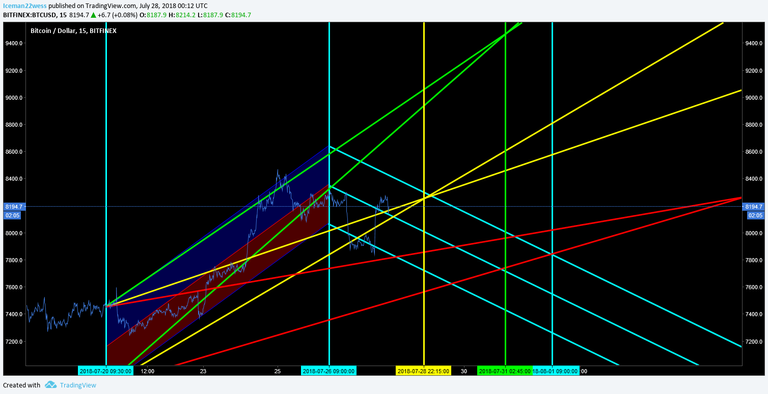
Time to take a closer look and see if we can get a juicy one of these charts. For this one, I am projecting up to 8-1 in an attempt to predict how we will trade up to the first chart.

Here we go, no bearish cross, but we have a trend reversal, and a bullish cross. This chart is pretty clear for me. If the price reaches up to 8.6k-8.7k, this is a shorting opportunity as the upper green lines are resistance points. Sorry that the colors have to flip or it messes the signals up. A dump down to 7.8k area is a buying opportunity. This remains true up until 8/1/18. Taking this further, when the price crosses the yellow cross on 7/28 we can expect the direction of the trend to reverse. The green signal is the first chance for a bullish move. This isn't going to be to 9k though. We should be breaking BELOW the yellow lines, and staying there until after 8/1, which means when the green signal line crosses, the max move up is to about 8.6k.
In conclusion, the signals are bullish in the coming days, but if you buy now, the bullish move might just be bringing it back to the price it is now. The best way to do this is to look on 7/28, see what it did the past day, and take the opposite position as a cross of the yellow reversal signal is made. (I lean strongly this is a shorting chance) When we get to the green line on 7/31, it should be a buying chance, wherever the price may be at that time. That bullish move needs to be closed no later than on 8/1.
Thanks for reading,
-Icee-
Please leave me an upvote and remember this is not trading advice.
P.S.
If you are curious how this works out, here are some examples of previous back testing using this kind of chart.


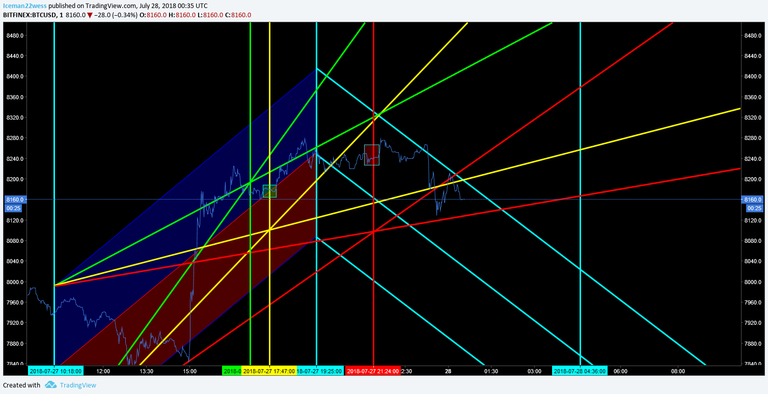
Finally, here is the 1 minute live chart I am currently trading, just so you can see what I am looking at.

As you can see here, I covered my long and took a short at the red box, and am looking to close it as soon as we touch the lower red line. If we never touch it, I will close it by tomorrow by the time constraint.
Damn bro, u are really getting good with these! I can see why this technique is so fucking good.. Thanks for writing this up for me, i really appreciate it.. resteemed
I am still perfecting it, which is why I haven't been posting. I am certainly on my computer, but I am hesitant to write articles until I have a firm grip on this strat. There are factors I have to consider when I draw the red and greens lines I have to be VERY careful about. I have ironed out probably 100 different issues, it's close to perfect but not quite there yet. When I get this perfect I will be back writing again more.