Understanding the Simple Moving Average Trading Strategy
Technical trading can be somewhat daunting for newer cryptocurrency investors. And, to be honest, there is a bit of a learning curve. Yet there are also some widely-used indicators that are both highly useful and extremely simple to understand.
And perhaps no indicator better fits this description than the simple moving average.
What is Simple Moving Average and How is it Calculated?
Simple moving average (SMA) is a basic technical trading tool that gives investors a key data point to use when evaluating market entries and exits. To calculate an asset’s SMA, traders apply a relatively straightforward formula:
- The closing price of an asset is added across a number of time periods, then divided by that same number of time periods. The resulting figure is the asset’s SMA.
Let’s look at an example of this calculation in action. Let’s assume that an asset closed at the following prices over a five day period: $100, $105, $103, $107, $110.
To find the asset’s SMA over this five day period, you would add those five numbers, which would give you a figure of $525. Next, you would simply divide $525 by 5, which would give you a figure of $105 — your SMA for that five day period.
It’s important to understand that the time period over which SMAs can be calculated is flexible — traders can look at short or long-term averages. An SMA can be calculated over hundreds of days or hundreds of minutes, depending on a trader’s needs and strategy.
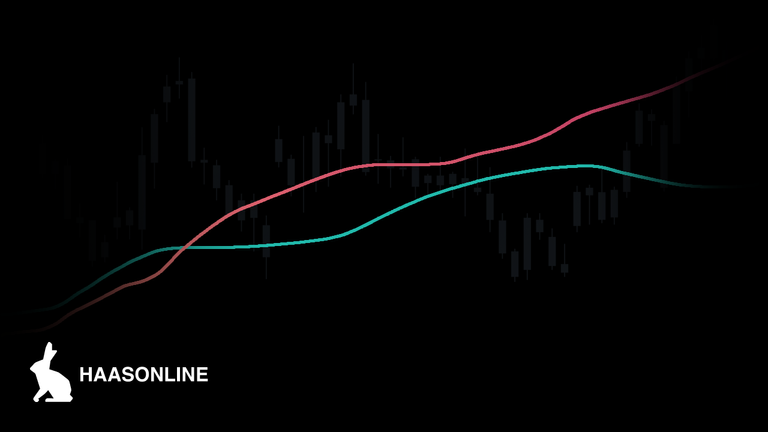
By calculating SMAs, traders can identify evolving market opportunities and then act on them. For example, when short-term averages cross above longer-term averages, this often indicates that an uptrend is present. Calculating SMAs can also help give traders a clearer picture of a price trend, as it smooths out volatility and reduces the noise seen in price charts. Longer time frames result in smoother averages.
Traders in both the equities and cryptocurrency markets use SMAs in the same manner, which means stock and a cryptocurrency moving average are rooted in the same principles. With that in mind, let’s take a closer look at some popular simple moving average cryptocurrency trading strategies.
Trading Strategies Associated With Simple Moving Averages
The most popular trading strategies associated with the SMA indicator involve so-called “crossovers” such as the Golden Cross and Death Cross.
A Golden Cross is a bullish signal that occurs when a short-term moving average crosses above a long-term moving average. On a chart, this is represented by two intersecting lines (short and long-term). The point where the short term line crosses the long-term line and begins to ascend is the Golden Cross.
A Golden Cross supported by rising volume is considered to be one of the strongest indicators that an upward trend is in effect, marking it as a buying opportunity for cryptocurrency traders. Additionally, the longer the time period, the stronger the trend is typically considered to be. For example, a 50-day SMA crossing over a 200-day SMA would be regarded as a highly bullish signal that could herald a sustained uptrend.
Golden Cross signals are commonly used alongside momentum indicators (such as Relative Strength Index) to provide traders with a clearer picture of market conditions, as greater momentum can offer supporting evidence of an uptrend’s strength and staying power.
A Death Cross, on the other hand, is considered a significant bearish signal, indicating that a downtrend is forming. A Death Cross occurs when a short-term SMA crosses below a long-term SMA. The Death Cross is widely considered to be one of the most reliable harbingers of a serious downturn. When analyzing historical charts of the S&P 500, for example, you can see that Death Crosses formed in advance of some of the worst market crashes in history, including 1929 and 2008.
It’s important to understand, however, that a Death Cross does not necessarily mean an imminent crash. In many cases, it may indicate a small correction, and an opportunity for savvy traders to “buy the dip.” In most cases, however, it should be regarded as a possible sell indicator.
Other Strategic Uses
A simple moving average formula, once calculated, can also serve as support or resistance, depending on whether an asset’s price is in an uptrend or downtrend.
Cryptocurrency day traders often calculate shorter SMAs, as they tend to track price movements more closely. The longer the time frame used, the more “lag” there is within an SMA calculation (lag is the amount of time it takes to reflect possible reversals). The shorter the SMA’s time frame, the greater the number of reversal signals.
In addition to simple moving averages, traders can also calculate exponential moving averages, which work much in the same way but are designed to privilege more recent price data. Simple moving averages, on the other hand, weight all price data equally.
Finally, moving averages also help form the basis of other key technical indicators, including the MACD (moving average convergence divergence), a trend-following indicator based on exponential averages that helps cryptocurrency traders identify when bullish or bearish momentum is present.
The Takeaway
Overall, the use of a moving average is an attractive tool for cryptocurrency traders because it offers three key attributes: It is one of the most basic and easy to use of all technical indicators, it can provide clear buy and sell signals and it is flexible enough to meet the strategic needs of both day and longer-term traders.
While there is always some risk involved in trading, a simple moving average trading strategy is a natural place to begin for newer cryptocurrency traders. Using this strategy in conjunction with automated trading bots can make the process much simpler.
If you’re interested in learning more about how technical and algorithmic trading can work for you, we encourage you to try our free demo for a deeper understanding of the our automated trading software.
Originally published at https://www.haasonline.com on January 13, 2020.