About a week ago, a report from Bloomberg mentions that a death cross on the bitcoin daily chart is on its way to trigger a sell action that would potentially get bitcoin down to 2800$ (as they claimed)
First of all, what is a death cross? A death cross is when a cross occurs of the 50-day moving average and the 200-day moving average occurs. According to Bloomberg, expert analysts expect a heavy fall in price over the coming weeks.
We are here so we can examine (in depth) if the death cross will ever occur. And if it does occur, what day do we expect the Moving averages to cross.
Here is the chart for bitcoin right now
As you can see the current price of bitcoin is at 8066.1$/BTC. The 50 Day MA and the 200 Day MA are very close to touch each other and crossing.
First of all we have to look back at how we calculate the moving average in order to move forward with our analysis. The moving average is calculated by average closing prices of the last 50/200 dats. When 1 day passes by, the close price of thid day will enter the average and projected to the price of the MA, while the first closing price (50 or 200 days back) is removed from the average.
Now we have to play with 3 different scinarios.
1- First scenario is that btc for future days will remain the same at roughly 8000 $/btc
This scenario will be considered for 7 days.
So now how will a 7 continiuos days of closing price of average 8000$ affect the moving averages. Lets calculate.
The 50 day moving average sits down currently at 9400
And the 200 day moving average sits down on 9315$
Let’s look at the closing prices of bitcoin at 50,49,48,47,46,45,44 and 200,199,198,197,196,195,194 days back
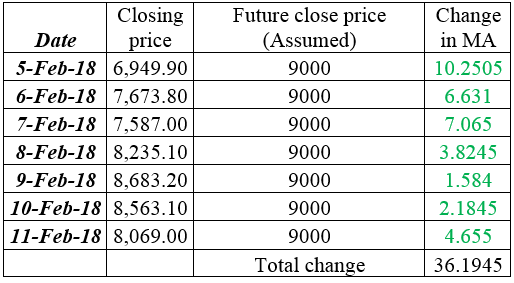
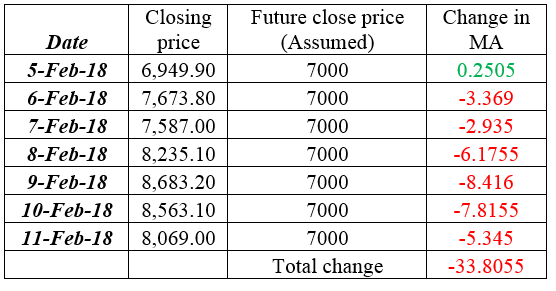
50 Days back (February 5 to February 11, 2018)
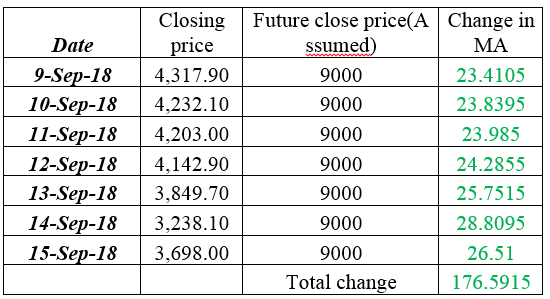
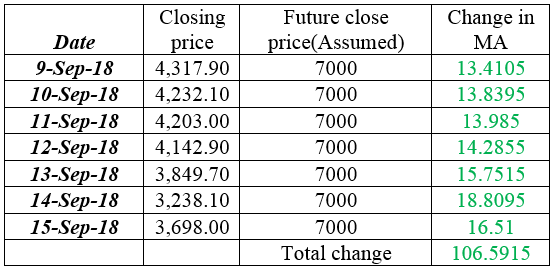
200 days back (September 9 to September 15, 2017)
Now assuming for 7 days the closing price is 8000$
The total move on the 50 day moving average will be 9400+1.2= 9401.2$
The total move on the 200 moving day average will be
9315$+ 141$= 9456$
As you can see the 2 moving average crossed. If the future price is around 8000$
The cross would occur after 5 days on 1 April 2018
Scenario 2: Now assuming for 7 days the closing price is 9000$
The total move on the 50 day moving average will be 9400+36= 9436$
The total move on the 200 moving day average will be
9315$+ 176$= 9491$
As you can see the 2 moving average crossed. If the future price is around 9000$
The cross would occur after 6 days on 2 April 2018
Scenario 3: Now assuming for 7 days the average closing price is 7000$
The total move on the 50 day moving average will be 9400-36= 9376$
The total move on the 200 moving day average will be
9315$+ 176$= 9421$
As you can see the 2 moving average crossed. If the future price is around 7000$
The cross would occur after 5 days on 1 April 2018
Given the bearish trend of BTC at the moment I believe somewhere between scenario 1 and scenario 3 will occur where the average closing prices of bitcoin is between 8000$ and 7000$
The cross will definitely occur on April 1 2018
Ironically on April fool’s day.
Bitcoin’s April Death Day


You have studied well, but we should know it in the time not before.
Well there is only 1 way to find out. Time will tell!
Yes, of course.
Congratulations @gogogaming! You have completed some achievement on Steemit and have been rewarded with new badge(s) :
Click on any badge to view your own Board of Honor on SteemitBoard.
For more information about SteemitBoard, click here
If you no longer want to receive notifications, reply to this comment with the word
STOP