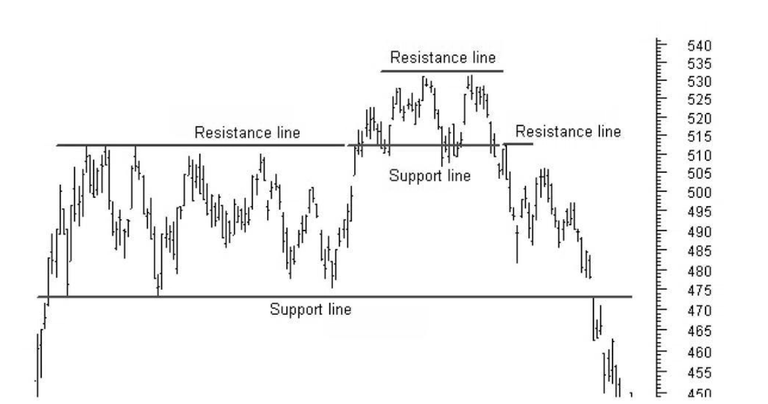
How to read Charts: Today's topic Resistance Line vs Support Line

You will often hear of either support or resistance lines in technical analysis. They can prove very useful when trying to predict where the price action will go.
Support levels are where demand is perceived to be strong enough to prevent the price from falling further, while resistance levels are prices where selling is thought to be strong enough to prevent prices from rising higher.
Support and resistance levels are psychologically-important levels where a lot of buyers and/or sellers are willing to trade the stock. When the trendlines are broken, the market psychology shifts and new levels of support and resistance are established.
This is basic but very important to know when dealing with charts.
I like your work dear
You and analyst @salahuddin2004 are two top analysts of cryptoworld.
His prediction success rate 98%
But I like your work most. Keep posting