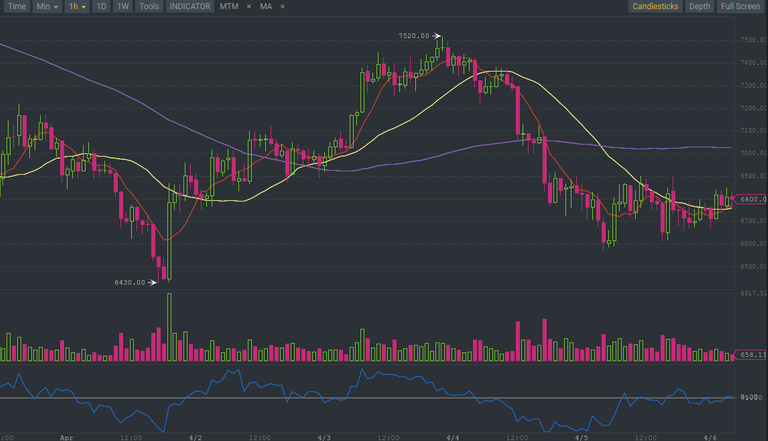
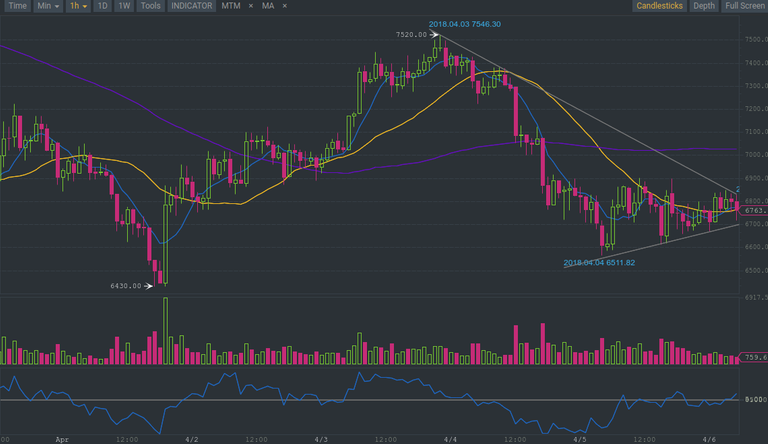
There is a slight possibility that a trend reversal at around 6800 may be occurring at the moment.

An imperfect double bottom is visible in MA 25 line (yellow). MA 99 is purple, and it seems to have flattened. It could begin reversing in a week or two.
The hourly chart suggests that by MA 7 crossing MA 25, we might be testing for another steady ascend. The next resistance ought to occur at 7500-8000 band. However, the difference right now is that big buyers have started appearing. Therefore, there is increasing volume, as well. All of which points towards the possibility of a trend reversal having begun. If the reversal is confirmed, in the next week, the trend reversal would have had to cascade towards longer term trends.
In the hourly chart, the falling wedge pattern is observed recently. A reversal may be expected at around 6750 in 4h according to the pattern (currently 6757 on binance)

Trend indicators such as MTM show that hourly trend is at the moment upwards.
I think we are in for another spill down. Long term target is 6K.
https://www.tradingview.com/x/WltRp7ck/
That did happen and it was quite painful :)
I posted an update soon after on smaller timeframe :D 6k target is still in play unless Bitcoin cracks above the $8,000 level and holds in my opinion
I think the next resistance is around 8000-8500 but should be broken in a few days. Bulls on! :D