Summary:
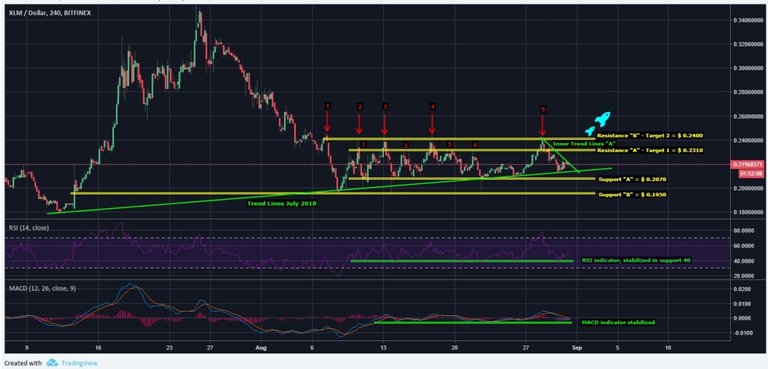
Stellar (XLM), comes in a strong price drop since the end of July more than 40%, during the month of August it managed to stabilize between the supports indicated in the graph (Support “A” and “B”) and the resistances indicated ( Resistence “A” and “B”), marks an accumulation of prices as indicated in the Dow theory, where we have high probabilities of recovering good prices once these resistances are overcome, however, I have several purchase recommendations …
Investment:![XLMUSD-H4-31-Aug-2018-X-1200x576.jpg]
For the graphic in the frame H4
Scalping
1.- BUY to the rebound of the Trend Lines July 2018
2.- BUY Support “A”
3.- BUY Support “B”
All purchases are likely to give a 3% Profit
Short-Term
1.- Wait Rupture of the inner Trend lines “A” and Bounce on the Trend Lines July 2018 looking for the Profit ..
Target 1 = $ 0.2310
Target 2 = $ 0.2400
Medium term
1.- Wait Rupture of the resistence “B” $ 0.2400
Target 1 = $ 0.2700
Stop Limit = Calculate at 3% or 4% as Maximum from the point of BUY
The MACD and RSI indicators are stable confirming the accumulation of prices, there is no divergence.
You have a minor misspelling in the following sentence:
It should be resistance instead of resistence.https://steemit.com/bitcoin/@durval/btc-corrects