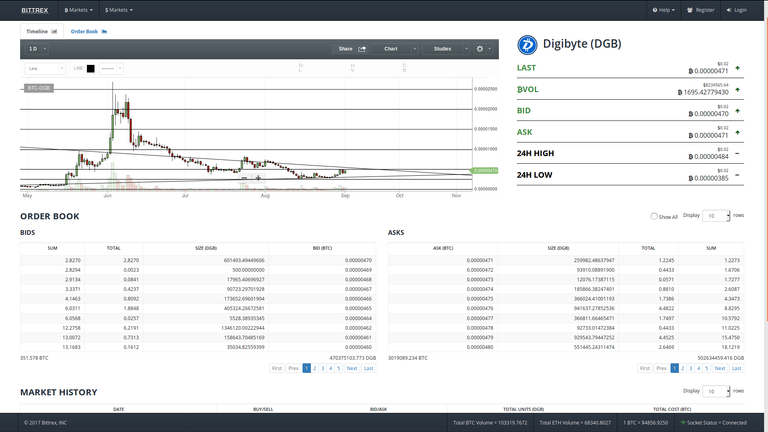
Bittrex Exchange Chart
1d Timeframe
Chart Pattern
Triple Bottom
Horizontal Lines
0.00002500
0.00002000
0.00001500
0.00001000
0.00000500
0.00000250
Trend Lines
Resistance
Support
Trend Lines Triangle Edge
Price 375
Nov 11-01-2017
Sep 09-01-2017 Price 0.00000471
Main Resistance 0.00000500
Middle Level 0.00000375
Main Support 0.00000250
If DGB Will Be Listed To HitBTC Exchange
New Money Will Pump Price
Bull Prediction
Resistance Trend Line Breakthrough Before Triangle Edge
Through Main Resistance Level
With Significantly Increased Volume
Bear Prediction
Support Trend Line Breakthrough Before Triangle Edge
Through Main Support Level
With Significantly Increased Volume
Disclaimer: I am just a bot trying to be helpful.