
You might have gathered already some cryptocurrencies and you are just holding them, but thinking how nice could be to have more knowledge about how the charts work so you could take profits from the market volatility. My advice is that the best way of making money with cryptocurrencies is doing something else, just hodl.
There are a lot of factors that get involve: daily news that can change completely the short term, like today’s Chinese ban to ICOs, “big whales” (investors that were early adopters that owns huge amounts of assets) movements that can turn your head around if you try to follow them, they can move the market as they please for getting the next big cryptocurrency cheaper provoking FUD (Fear, uncertainty and doubt) in the rest of investors, and so on.
That’s why my advice is that if you just have some savings and you want to bet on the cryptocurrency market because of your own research, then just hold your positions, we are still in the beginning of the road, governments are just starting now to regulate the cryptocurrency world and this is a good step forward to begin to take this seriously in the mainstream. For trading I suggest you to** be always informed of the news related with cryptocurrencies and learn more and more about new projects and their technology**, a good start could be to try to understand the market’s top 10 cryptocurrencies, their pros and cons and what makes them unique. Knowing what you are reading and checking others’ point of view is the only valid way to be sure of your positions.
If this warning is still not enough to make you change your mind and you still want to learn about trading, let’s see how to read some charts and the main indicators to look at.
To start, let’s go to Tradingview.com. This website will give us all the tools that we need for checking the charts on real-time. We will need to create a free account, the premium one is only letting to add more indicators and not limiting the tools, but for starting with the free account we are good to go.
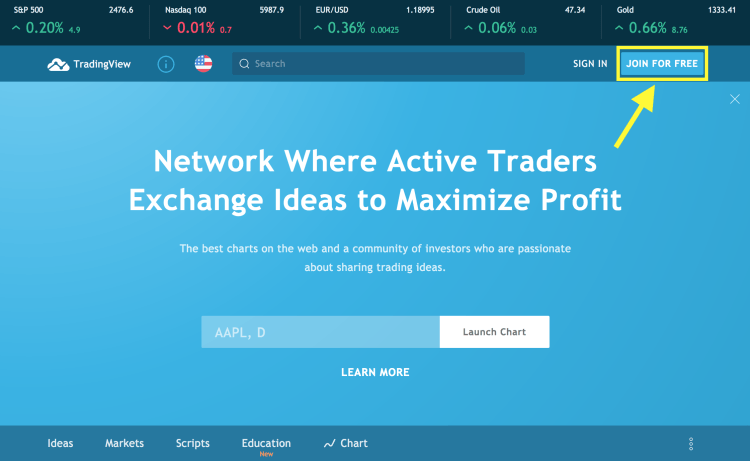
Once you have created your account, you will see on the right side of the page a toolbar with different options. Click on “Watchlists, details and news” to open a right tab. Click on “Add Symbol” and choose the currency pair you are interested on. On this example I will choose ETHEUR of Coinbase Exchange.

Once you’ve added the ETHEUR pair, click on it on the Watchlist tab and click on Interactive Chart in the page that is showing.

This will open the candle stick chart like the following:
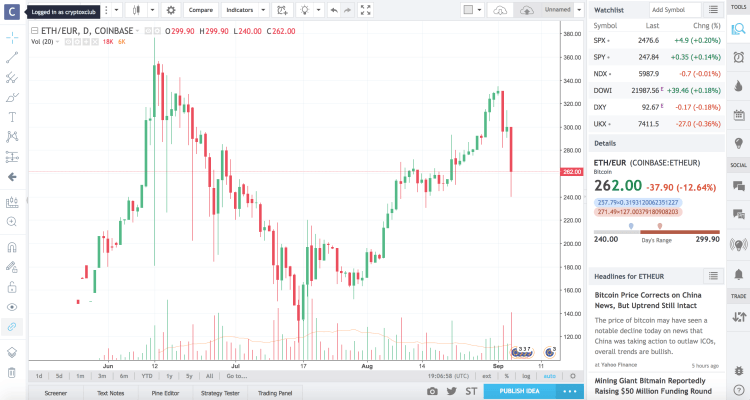
So now to understand this chart let’s go one by one checking what’s in this page. If we check on the left bar of the page, we can see a set of drawing tools that are really useful for example to paint support/resistance levels like the next ones.
Support/Resistance Levels
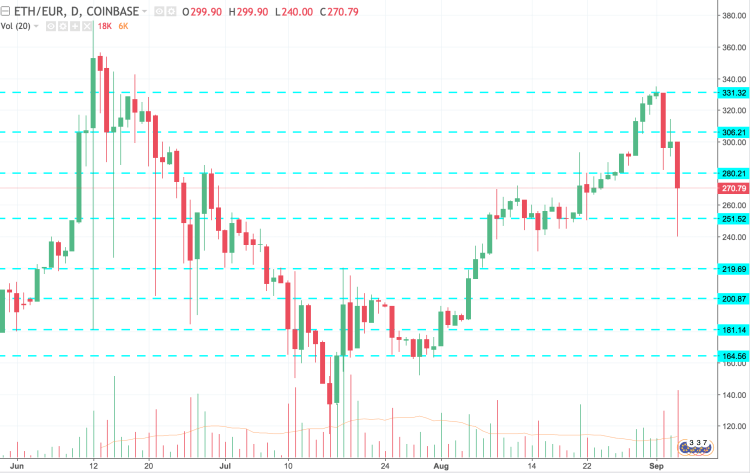
All those blue lines that I painted are support/resistance levels, depending on if the price is above or below the line. These levels represent investors’ psychological barriers, usually they match with round numbers, as we can see in this chart (165, 180, 200, 250…). When people invest they try to think about round numbers, is how our mind works, when we buy on a shop, we usually think about round prices, we think about more or less 2 euros, instead of thinking on the right price that is 1.83 euros. So the more times these levels are touched without passing them, the stronger they get, and more difficult to break.
Candle Stick Bars
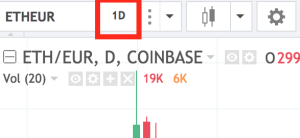
Another interesting thing to have in mind is to understand how these bars that we see in the chart are working. On the top bar of the chart, next to the currency pair (ETHEUR) there is a selector with the value “1D”. If you click on it you can choose different periods of time. This means that each candle bar that you are seeing in the chart represent that period of time, in this case, one day.
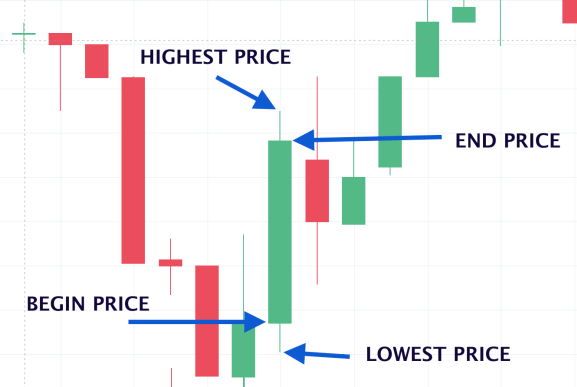
Let’s now check how to read a single candle stick bar. Every time a new period of time starts in the chart, the current price is registered for starting a new candle, as during that period of time there might be some low and high peaks, these are represented by a thin line and when the time finished, the candle is created between the starting price and the end price. If the end price is lower than the start one, the candle stick would be red and green on the other way around. With this you can read already different scenarios of a same currency pair depending on if you are interested in the short term (30 min chart) or the long term (4h or 1D chart).
And that’s all for today, in another post we will check some useful indicators to keep an eye on and how to use them.
IMPORTANT: Never invest money you can’t afford to lose. Always do your own research and due diligence before placing a trade.
If you want to keep up with our latest news please:
Download our free Android App
Hang out with us in our Slack
Follow Crypto-X on Facebook
Follow Crypto-X on Twitter
Follow Crypto-X on Steemit
Follow Crypto-X on Reddit
Follow Crypto-X on Medium
Donations:
♥ BTC: 14a9FrErT8j3Pp6iJSurXsrNkSqrirV7qe
♥ ETH: 0x5f982128fe96560544feef7edfbf503ab17a134f
♥ LTC: LQPkLe6xYhBxU4knEYP7rACUfj3aevfPtU