Hello people. Lets look today at NEM.
https://ru.tradingview.com/x/cQSa5Gpb/
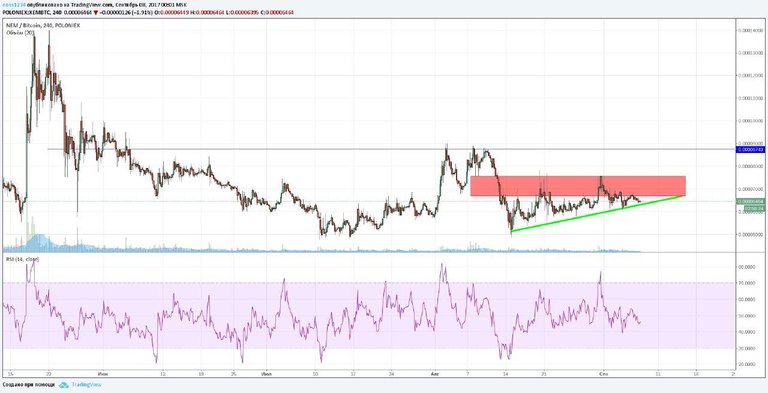
As we can see, NEM now is in ascending triangele. Price is moving by the green trendline and can make breakout anytime now. Resistance level from 0.00006500 to 0.00007500. After breakout price can move to 0.00008700. There we can see strong resistance. But this trade is risky, because of total market situation.
Is it risky to buy?
a little bit. But this is trading)
Ah, thanks for sharing. I will also check what others are saying. :)
Nice cahrt, i think
"chart". Thank you
Is this solid coin?
yes, this coin is nice
Most important factor is missing mate, volume!
oh, you are right! Thank you, always forgetting about it!
NEM is XEM on Polo?
you are right)
Is this solid coin?
yes it is
Спасибо, я уже и забыла про этот коин)
пожалуйста, вот я и напомнил)
NEM seems very stable. An immediate break out is not really in the cards, it seems, but the price seems to be building base after the double bottom.
Thanks for your Interesting thoughts.
pocketsend:100@burmik123
Successful Send of 100
Sending Account: wekkel
Receiving Account: burmik123
New sending account balance: 995497
New receiving account balance: 99
Fee: 1
Steem trxid: a2b4b302c82bd24fa2b369a02af79e647b96337a
Thanks for using POCKET! I am small bot and right now I am running this code.
Successful Send of 100
Sending Account: wekkel
Receiving Account: burmik123
New sending account balance: 995497
New receiving account balance: 99
Fee: 1
Steem trxid: a2b4b302c82bd24fa2b369a02af79e647b96337a
Thanks for using POCKET! I am running this confirmer code.