
Hello Lads and Ladies,
Today we are taking a look at WABIBTC as it has been requested already today.
Starting off with the daily we can see the over all situation that we are having right now.
WABIBTC has been in a steady downtrend and staying pretty constant under the middle of the Bollinger Bands. As the distance between the chart and the middle line got too big around 5 days ago, WABIBTC has started its increase towards it again. During this increase we have seen one day of literally rocketing but of course that has not continued and looking at the daily the candle still closed in a normal manor.
Right now, it seems like it is getting rejected from the middle line and having a negative close today.
ANYHOW, the current situation looks very bullish to me on the daily.
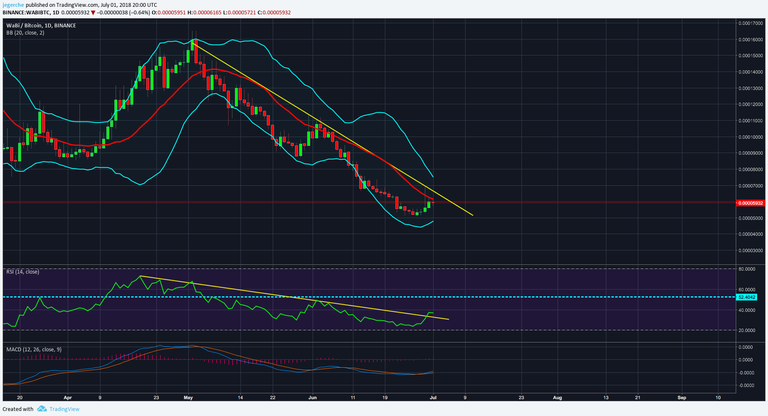
The reasons for the bullish mindset has a few reasonings. First one is the historic RSI data. WABIBTC finds itself in its low regions of RSI points and has been increasing since the last low at 5100 sats and 23 RSI. Taking a closer look at the RSI, we can see that it has actually broken its downtrend and now is testing the 40 point support and resistance line. Should this line become support, then it is going be heading to its very bullish regions of over 52 points.
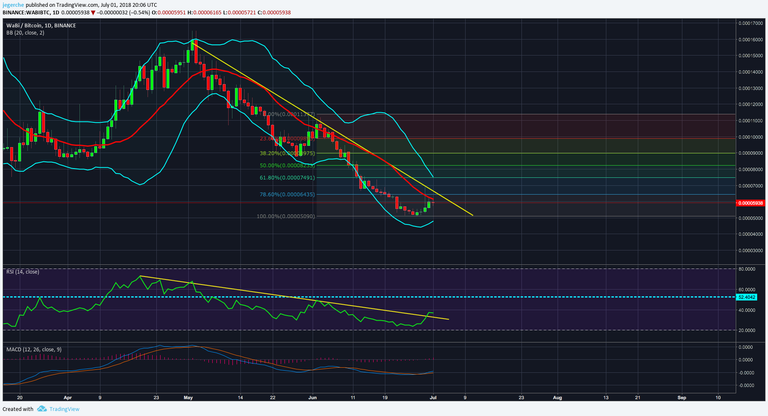
Now taking the downtrend itself into consideration, we see that WABIBTC is coming to an end of it and is getting ready to leave it, especially with the increasing indicators. Nevertheless, using the Fibonacci Retracement, we can see that the first stop is the 78.6% line, where the downtrend resistance and the and the middle of BB are all merging in this area, which puts a lot of resistance for one time for that area. YET, this does not mean that WABIBTC will hit here and continue its downtrend. It actually looks very much like that we are going to "repeat history" and see it testing the 61.8% fibs line. From there on, we will have to see what happens and if we can actually completely reverse the trend, or if this was just a simple retracement.
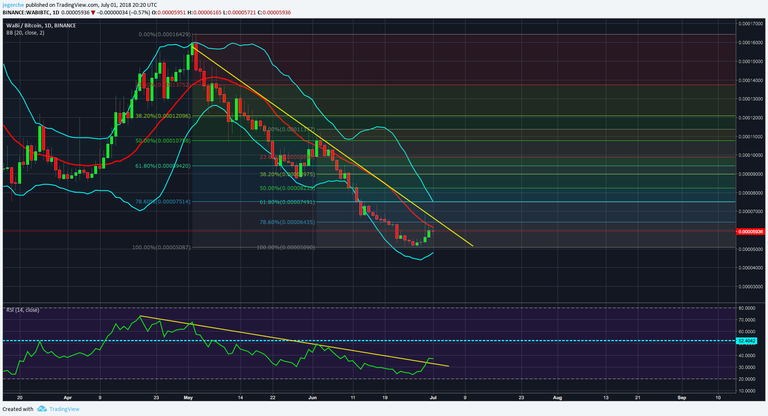
In addition, looking at the Fibonacci Retracement that could be used as well and overlapping this one with the previous one, we see very clearly that its 78.6% line is exactly the same as the just mentioned 61.8% line. This indicates a strong pull of the chart towards this line.
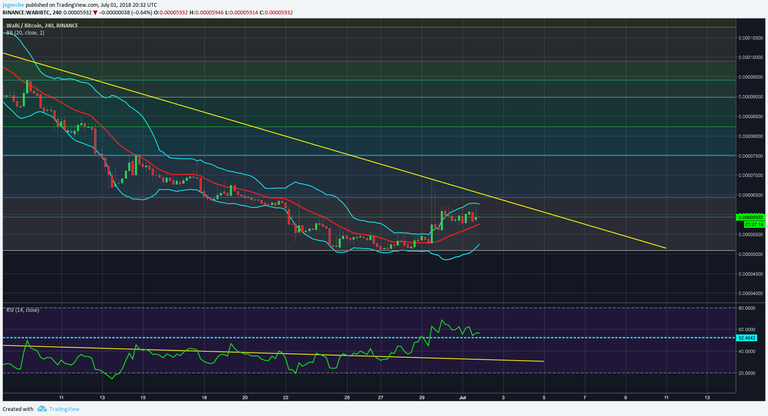
Taking a look at the 4h chart, brings me to the final decision and statement what is most likely to happen.
In my opinion, we will see just one small pullback within the next few days, so we can go shortly under the middle of BB on 4h and on the daily reject at the middle of BB and just get a little more momentum and volume to actually break this strong resistance. After breaking resistance,we might get fast to the overlapping fibs lines at 7500 sats. From there on, I am sure that we will see a bigger pullback to the regions of 6000 sats again and then start the next big push towards the "big scale" 61.8% fibs line at 9400 sats.
To make it very simply, I will ENTER @5500, SELL @7475, RE-ENTER @6500 and SELL @9400. From there on I will update it and look into it, so we can see what happens next.
Make sure to check it out on Tradingview - https://www.tradingview.com/u/jegerche/
Instagram - https://www.instagram.com/bitcoin25.de/
Twitter - https://twitter.com/mreucho/
 me and you will find this page interesting because I am a TA expert and day trader that does daily updates and new posts about the hottest and most discussed coins.
Cheers, Tomas
Hello i gave you an upvote dont forget to follow me for future upvotes & i always follow back