
How might the crypto economy be evolving?
Many people put their attention to trading indicators or the news of relations between crypto companies and large-scale institutions however the truth of the matter is that the creation of this "blockchain system" and this "tokenization" of security & commodities exchange ( especially when coupled with the Internet of Things & blockchain) create a novel Financial system in general.
This alters the structure under which financial dealings might be made.
Without going too in-depth on the intricacies of how finance has changed forever (unless government fiat lovers go big with the violence) I'd like to offer you all a quick little run down on some Crypto Market action.
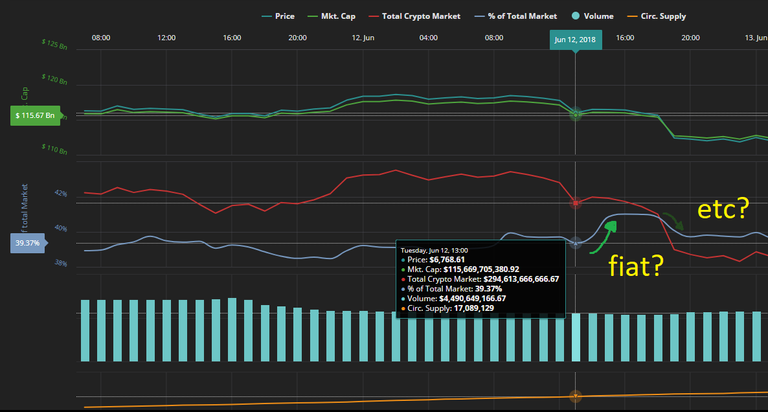
Last week coinbase, the u.s. Fiat dollar and American citizens favorite crypto Exchange, oddly in strange timing, put forth it's support for etherium classic (ETC).
Now the question was proposed to me how was market cap affected?
Within the overall Market trend of crypto asset depreciation against Fiat, There are dynamics between the cryptocurrencies themselves that are important to observe In that time when a coin is released or has some form of pump.
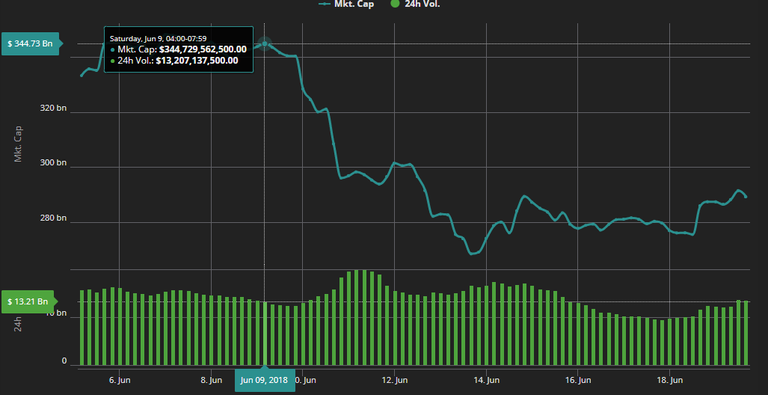
This last week we've seen a steep falling of the total crypto market capitalization. In fact from June 9th to June 12th we lost roughly 43 billion dollars at roughly 13%.
In the period of a day between June 11th & 12th we can observe that the total market capitalization percentage of Bitcoin fell by roughly one tenth of a percent maybe a little more. However, that is after a gain of roughly the same amount.
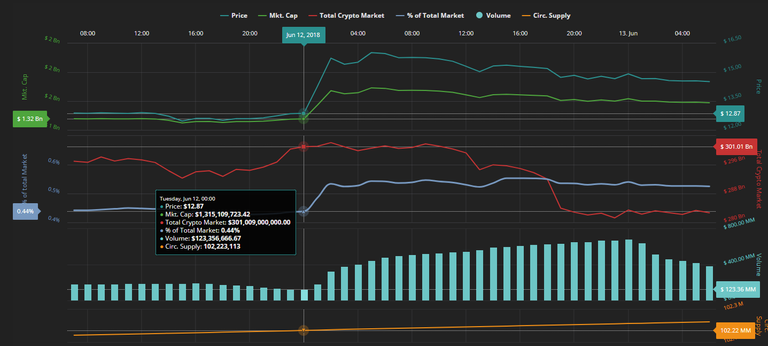
Correspondingly the Total market cap percentage of etherium classic increased by one tenth of a percent. This action is much more noticeable Within The ETC charts.
What does this mean?
Understanding the nature of this price action and this correlation of demand change in the market will give you the valuable insights necessary to start to model how different scenarios of cryptocurrency to cryptocurrency pair relations can playout.
However there are many more factors to consider and you have to include them all in your model to be most effective. For example you must consider why this change in market cap percentage occurs through understanding demand shifts. On the outside it looks as if BTC money went straight to ETC Which might be a reasonable analysis however we cannot rule out the effect of the demand across all cryptocurrencies & fiat together for BTC. A type of metric you might consider making is the demand index for a commodity focus on Fiat to crypto demand. Looking at the BTC market cap chart you can almost say with high probability that it looks as if fiat went into BTC then pumped to LTC
This of course gets more into how the nature of how money and software relate together (into cryptocurrencies) to form a financial structure… however that topic is for another time.
Thank you.. This helps my analysing skills.
Congratulations @altcoinninjas! You have completed some achievement on Steemit and have been rewarded with new badge(s) :
Click on the badge to view your Board of Honor.
If you no longer want to receive notifications, reply to this comment with the word
STOPTo support your work, I also upvoted your post!
Do not miss the last post from @steemitboard!
Participate in the SteemitBoard World Cup Contest!
Collect World Cup badges and win free SBD
Support the Gold Sponsors of the contest: @good-karma and @lukestokes
Very helpfull analysis, thank you!
you are very welcome.