Moving Averages
- Simply, a moving average is a way to level out price action over time.
- "Moving Average" means the calculation of the average closing price of the currency pair for a certain number of periods.
- Moving average indicator is used to forecast future prices. It helps you to determine the potential direction of market price.
2 Major Types of Moving Averages
- Simple Moving Average
- Exponential Moving Average
Simple Moving Average (SMA)
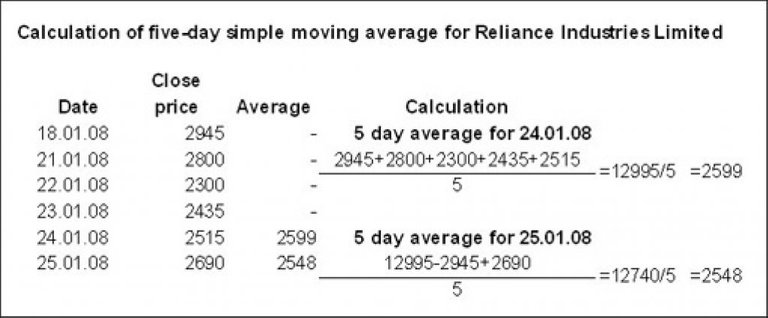
- Basically, Sma is calculated by adding up the last "x" period's closing prices an then dividing that number by "x".
- As you are taking the averages of past price history, you are only seeing the general path of the recent past which makes you have a direction of future short-term price action.
- The longer the period you use for SMA, the slower but safer it reacts to the price movement.
- SMA gives you clue whether the market is trending up, trending down or just waving.
However, one of the major problems is that: they are susceptible to spikes. Thus, they may give us false signals though it rarely happens.
 Sify
Sify

Exponential Moving Averages (EMA)
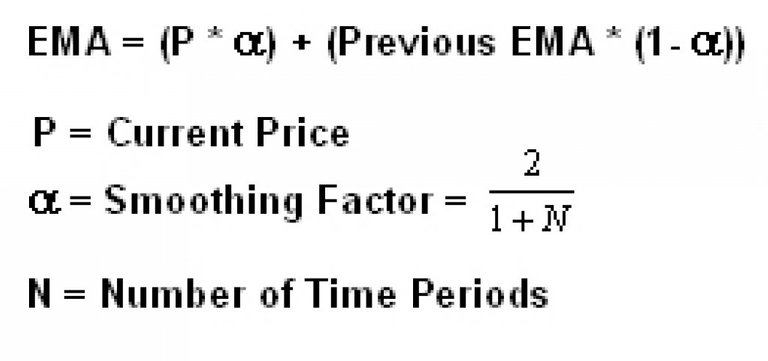
Basically, EMA gives more weight to the most recent periods. In other words, exponential moving averages place more emphasis on what has been happening lately.
The exponential moving average (EMA) is a weighted moving average (WMA) that gives more weighting, or importance, to recent price data than the simple moving average (SMA) does. The EMA responds more quickly to recent price changes than the SMA. The formula for calculating the EMA just involves using a multiplier and starting with the SMA. Investopedia
Simple vs Exponential Moving Averages
- One way to use moving averages is to utilize them as dynamic support and resistance levels. Do not forget, they are constantly changing depending on the action of market price.
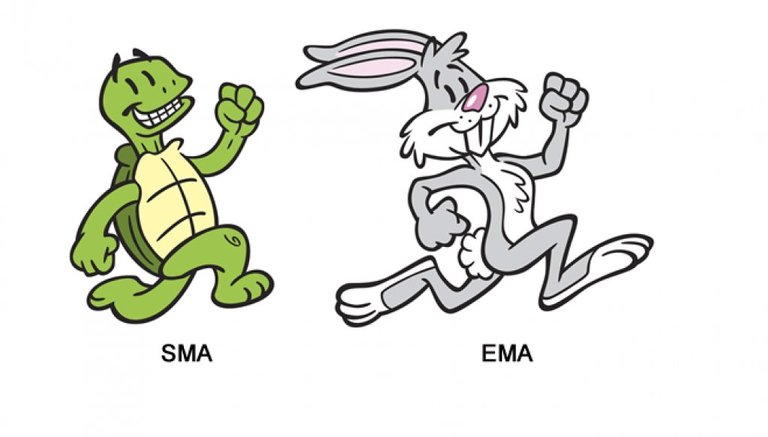
- When you want a moving average which will respond to the price action quickly, then a short period EMA is best for you.
- EMA can help you catch trend very early. However, the quicker a moving average responds, the more likely it to be caught in fake price actions.
- When you want a moving average that is smoother and slower to respond to price action, a long period SMA is the best way to go.
- You may use a longer period SMA to find out what the overall trend is and then use a shorter period EMA to find a good time to enter a trade.
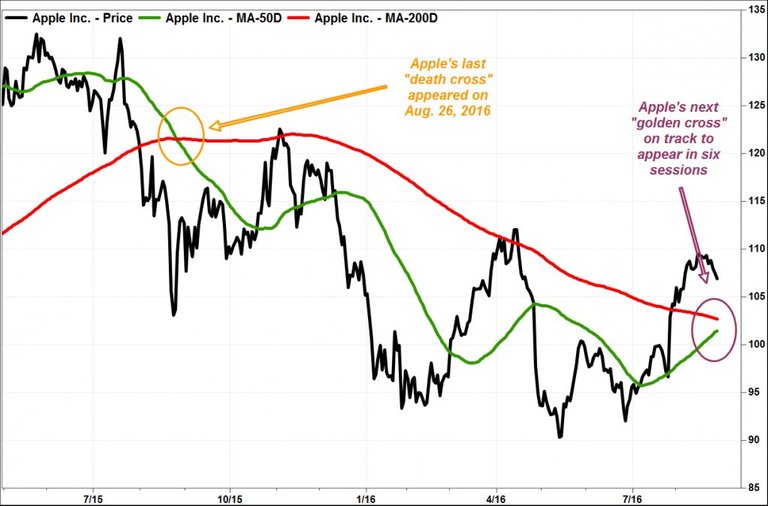
- If the moving averages cross over one another, it may signal that the trend is about to change.

The Golden Cross and the Death Cross
The golden cross and the death cross are exact opposites. The golden cross indicates a long-term bull market going forward, and the death cross signals a long-term bear market. Both refer to the solid confirmation of a long-term trend by the occurrence of a short-term moving average crossing over a major long-term moving average.
Investopedia
Babypips
Crypto-Education Series Episode 1
Crypto-Education Series Episode 2
Crypto-Education Series Episode 3
Crypto-Education Series Episode 4
Crypto-Education Series Episode 5
TURKISH
Hareketli Ortalamalar
- Sade bir dil ile, hareketli ortalamalar geçmiş zaman dilimi içindeki fiyat hareketlerinin gösterimidir.
- "Hareketli ortalama" fiyatların kapanış seviyelerinin belirli bir periyot sayısına bölünmesi ile bulunur.
- Hareketli ortalama göstergesi, fiyatların geçmiş hareketlerini baz alarak geleceğe yönelik fiyat tahminlemesine olanak sağlar.
2 Tür Hareketli Ortalama Mevcuttur
- Basit Hareketli Ortalama
- Üssel Hareketli Ortalama
Basit Hareketli Ortalama
- Temel olarak, belirli sayıdaki fiyat hareketlerinin ortalamasının alınıp, aynı sayıya bölünmesiyle ulaşılan ortalamadır.
- Geçmiş fiyat hareketinin izlediği trendi bulmanıza olanak sağlar. Bu sayede kısa dönem ileriye yönelik stratejinizi geliştirmenize yardımcı olur.
- Basit hareketli ortalamanın periyot seviyesini arttırdıkça, fiyat artış azalışlarına vereceği tepki de yavaşlar.
- Basit hareketli ortalama hesabında yaşanan bir sıkıntı olarak; yalancı çıkışlar (fake outs) fiyat ortalamasının gerçeğinden sapmasına nadiren yaşansa da sebep olur.
 Sify
Sify

Üssel Hareketli Ortalama
Üssel hareketli ortalama yalancı çıkışlardan arınma konusunda basit hareketli ortalamadan daha başarılıdır.
- Temel olarak, en yakın dönemdeki periyotlara daha fazla ağırlık vererek hesaplama gerçekleştirir. Yani diğer bir deyişle, yakın tarihte olan bitenle daha çok alakalıdır.
 Investopedia
Basit ve Üssel Hareketli Ortalama Karşılaştırması
- Hareketli Ortalamaların bir diğer kullanım türü de süreç içerisinde değişen destek ve direnç noktaları sağlamalarıdır.
Kullanımı oldukça yaygındır. Bunun dışında: - Fiyat hareketlerine hızlıca cevap verebilecek bir hareketli ortalama tercih ediyorsanız, kısa dönemlik Üssel Hareketli Ortalama (EMA) size uygun olacaktır.
- EMA, trendi hızlıca yakalamanızı kolaylaştırır.
- Ancak, bir hareketli ortalama fiyata ne kadar çabuk tepki veriyorsa, yalancı ani çıkışların etkisinde kalma ihtimali de o denli artar.
; - Fiyat hareketlerine daha yavaş ve yumuşak tepkiler veren bir hareketli ortalama tercih ediyorsanız, uzun dönemlik Basit Hareketli Ortalama (SMA) size uygun olacaktır.
- Uzun dönem Basit Hareketli Ortalama size marketin genel görüntüsün sergileyecek ve daha güvenli bir alım-satım ortamı sunacaktır.
- EMA ise daha kısa zaman diliminde alım-satım için pozisyon alma konusunda yardımcı olacaktır.
 Babypips
Altın Kesişim ve Ölüm Kesişimi
Bir çok tacir özellikle Ölüm Kesişimi (Death Cross) yaşanmasına karşın devamlı olarak hareketli ortalamaları kontrol ederek işlemlerini gerçekleştirir.
- Kesişimler trendin değişeceğinin göstergesidir.
- Ancak Altın ve Ölüm kesişimleri fiyat üzerinde son derece büyük etkiye sahiptir.
- Altın Kesişimi daha uzun periyotluk bir hareketli ortalamanın, kısa periyotluk hareketli ortalamayı yukarı yönde kesmesi ;
- Ölüm Kesişimi ise uzun periyotluk hareketli ortalamanın, kısa periyotluk hareketli ortalamayı aşağı yönde kesmesi ile oluşur.
 Babypips