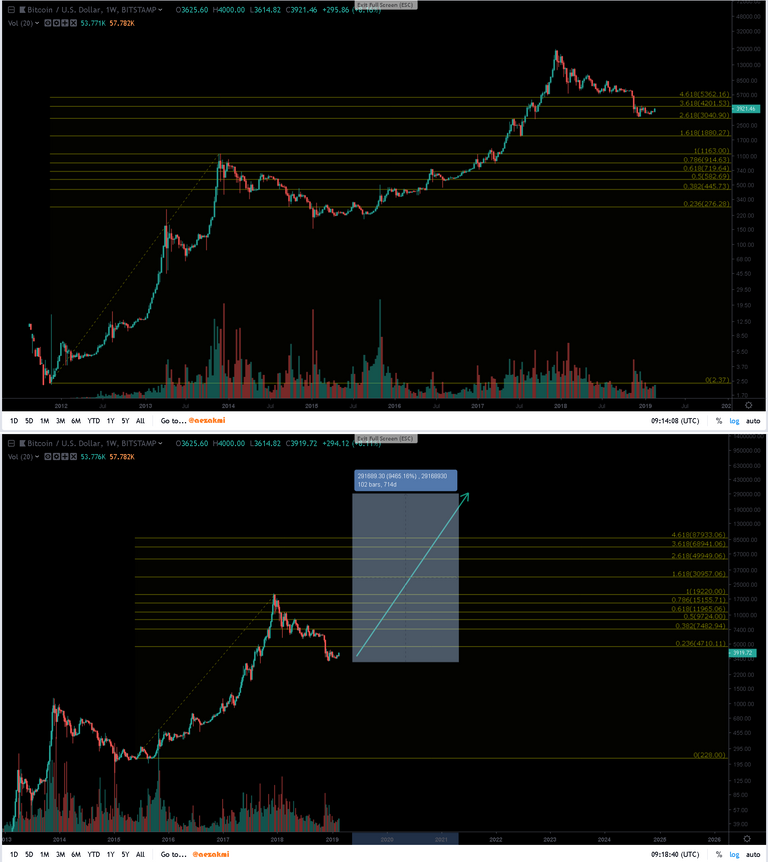
I so hope that you're right with this theory. 700 up and 400 down. It also makes a lot of sense. Well, I took your idea a little further and "Fibonaccied" the whole thing. Here's what came out:
Ctrl + Click here to enlarge the image in a new tab (steemitimages)

The top image shows us how different Fibonacci retracement affect Bitcoin's price action. The bottom image show us what (insane) price levels we might achieve, if we follow the same cycle as the 2012 -2014 one.
Long story short: this next cycle might change our lives. Cheers to that! 🍷
Well this idea of yours really got me and I ended up writing a whole post about it.
You can check out my whole post here 😁