For my 1st chart analysis I will review STEEM/USD
Chart time frame: Daily & 4 hour
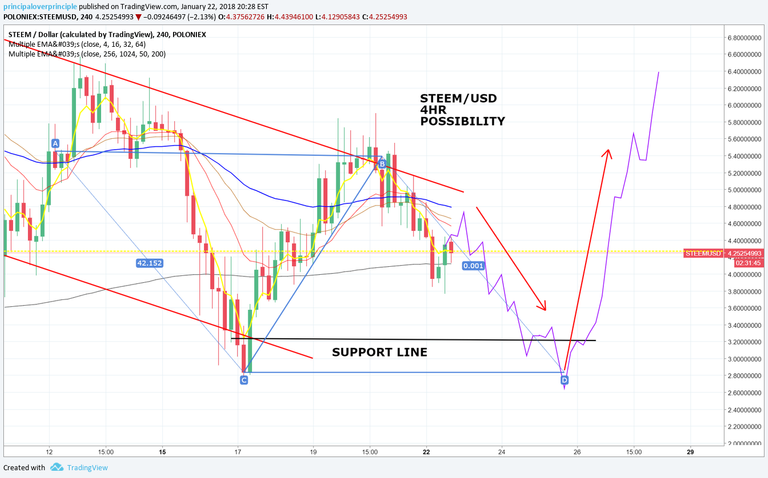
Harmonic Pattern (4hr): ABCD (Bullish)
Support Level $3 range
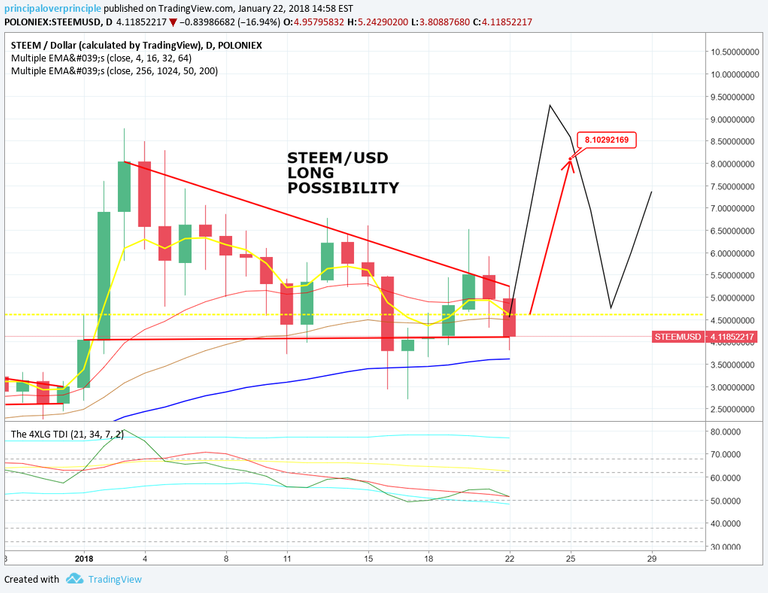
DAILY CHART

Daily chart shows a bullish pennant being formed. Looks like it ready to break soon. TDI (Traders dynamic index) Shows volatility band was broken on 1/16/18 which can be used to confirm a direction change.
4 HOUR CHART

A possible bullish ABCD harmonic pattern has been identified. This pair may still has a little fall left in it down to the support line. After that it possibly could bounce back to re-test the previous high around $8.
Disclaimer: This is just my theory. I am not making any recommendation to trade this idea. All traders/investors are advised to do their own research and analysis.
Come join my telegram channel for more chart reviews: https://t.me/competitiveadvantagefx
Trading view chart links
DAILY https://www.tradingview.com/chart/STEEMUSD/g5M6xGTM-STEEM-USD-POSSIBILTY/
4 HOUR https://www.tradingview.com/chart/STEEMUSD/ArL0ydhg-STEEM-USD-4HR-CHART-POSSIBILITY/


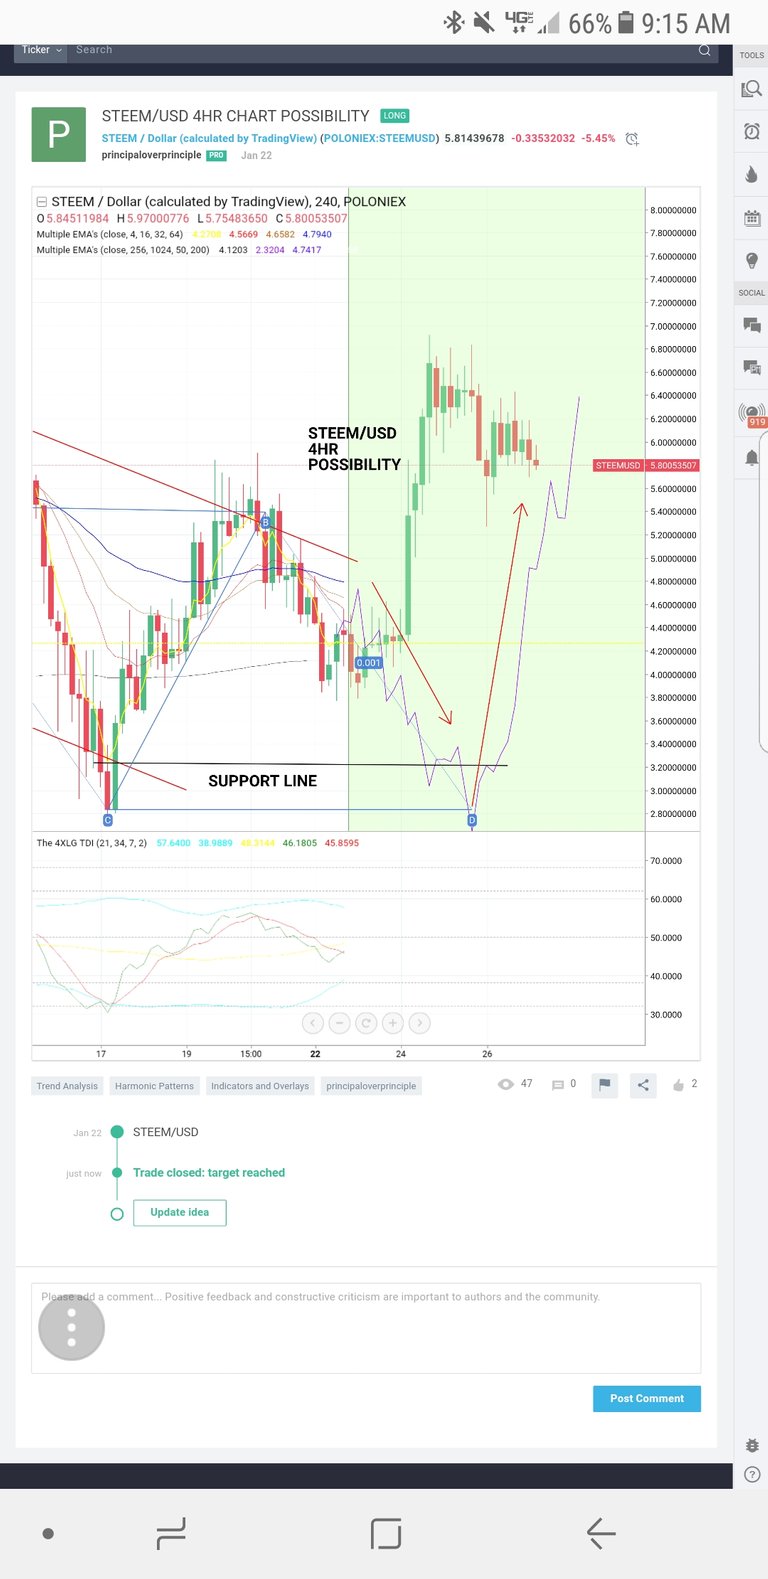
Quick update