
Bitcoin futures trading on the Chicago Mercantile Exchange has hit a new high. The open interest for Bitcoin futures is at 6,069 contracts, well above the previous high of 5,311 contracts reported on June 20.
This shows increased institutional interest. Though the number of people googling ‘Bitcoin’ is at a 17-month high, it is still way below the peak seen in 2017. This shows that the current rise is devoid of euphoria unlike the previous bull phase, which is a positive sign.
After Facebook, Goldman Sachs is now exploring options of tokenization, according to its chief executive David Solomon. Bitcoin’s resilience and its uncorrelated nature with other asset classes is attracting large players. Billionaire Henry Kravis has invested in a blockchain-focused fund run by his earlier employee Ben Forman.
Many believe that the rally in Bitcoin will be followed by a rally in altcoins. However, veteran trader Peter Brandt warns that similar to the dotcom era, only projects that have real value will survive and others will become worthless. Therefore, traders should be careful before buying the beaten down tokens.
American broadcaster Max Keiser and known bitcoin bull suggested that the cryptocurrency market rally will not include altcoins in a recent interview with CNBC.
Keiser said that with the development of the cryptocurrency space and adoption of Segwit and the Lightning protocol, people have began to understand the store of value bitcoin offers, as well as scaling that would happen off chain. This, per Keiser, made crypto owners move their funds from Altcoins back into Bitcoin.
LEARN HOW TO TRADE CRYPTOCURRENCY WITH A MASTER CRYPTO TRADER!
BTC/USD
 LEARN HOW TO TRADE CRYPTOCURRENCY WITH A MASTER CRYPTO TRADER!
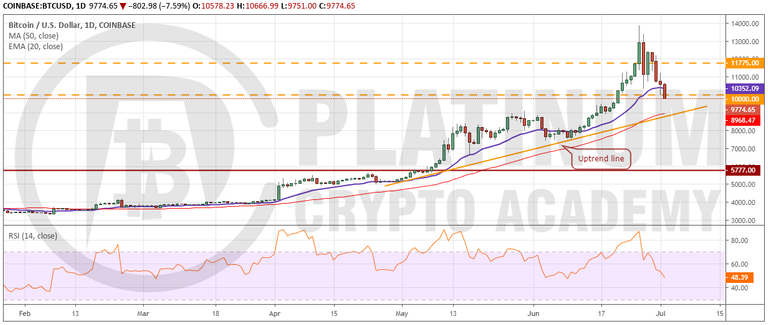
The momentum in Bitcoin easily broke above the overhead resistances of $11,775 and $12,985.55, mentioned in the previous analysis. It reached a high of $13,868.44 on June 26 from where it reversed direction.
Vertical rallies have an equally sharp pullback. The bulls have failed to stall the correction at the 20-day EMA, which is a negative sign. It can now drop to the 50-day SMA, which is a critical level to watch out for. The uptrend line is located just below the 50-day SMA; hence, we anticipate the bulls to offer some support around that level.
If the price bounces off the 50-day SMA, it can be a good buying opportunity with a close stop loss. But if the price slides through the uptrend line, the correction can extend to $7,400. The volatility is likely to remain high for the next few days. Traders should wait for the price to stop falling and stabilize before buying.
ETH/USD
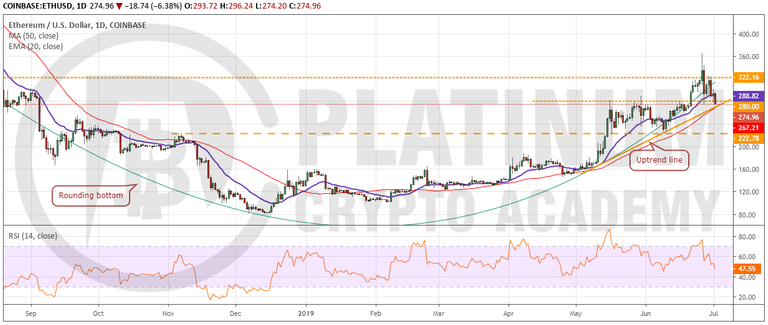
Ether broke out and closed (UTC time) above the overhead resistance of $322.16 on June 26, which completed a rounding bottom pattern. But we had advised against buying the breakout in our previous analysis. That helped traders stay out of a losing trade because the price reversed direction on June 27 and plunged below the 20-day EMA.
Though the bulls defended the 20-day EMA for a few days, the failure to resume the uptrend attracted profit booking. Currently, the digital currency has again plummeted below the 20-day EMA. The next support on the downside is at the 50-day SMA. We anticipate some buying at this level. If the price bounces off the 50-day SMA, the bulls will attempt to scale the overhead resistance level of $322.16 once again.
On the other hand, if the bears sink the price below the 50-day SMA, the next stop on the downside is at $222.78. The 20-day EMA is flattening out and the RSI is just below 50, which points to a consolidation in the near term. We do not find any buy setups at the current levels.
XRP/USD
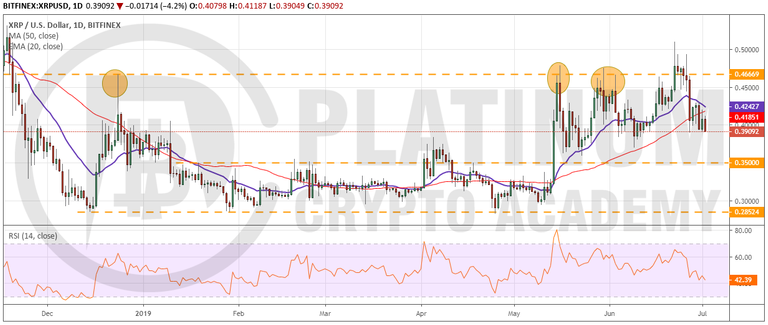
XRP struggled to sustain above the critical level of $0.46669 on June 25 and 26. Hopefully, traders would have booked profits close to this level as we had suggested in our previous analysis. Even if that was missed, we had mentioned to trail the stops below the 20-day EMA, which must have hit on June 27 as the digital currency plunged to a low of $0.390. The subsequent pullback could not breakout of the 20-day EMA, which shows profit booking on rallies.
Currently, the price is back at the critical support of $0.390. If this support cracks, the next support is at $0.350. The 20-day EMA is turning down and the RSI has dipped below 50, which shows that bears have the upper hand.
Any pullback will face resistance at the 20-day EMA and above it at $0.046669. Traders should wait for the price to stop falling and confirm a bottom before initiating long positions.
LTC/USD
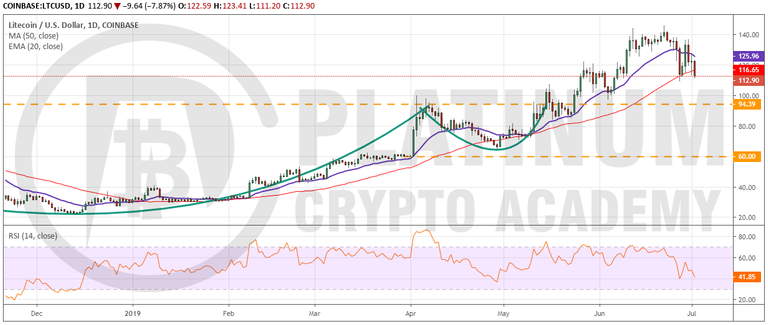
Our suggested stop loss was hit on June 26 as Litecoin broke down of the 20-day EMA. Currently, the price has broken down of the 50-day SMA, which is a negative sign. If the bears sink the digital currency below $109.09, the fall can extend to $94.39. This is a critical level where we anticipate buying to emerge.
The 20-day EMA has started to turn down and the RSI has fallen into the negative zone. This shows that the bears have the upper hand.
Contrary to our expectation, if the bulls defend the support at $109.09, the digital currency might again attempt to scale above $140. However, we give this a low probability of occurring. We shall watch the price action at $94.39 before suggesting a trade in it.
BCH/USD
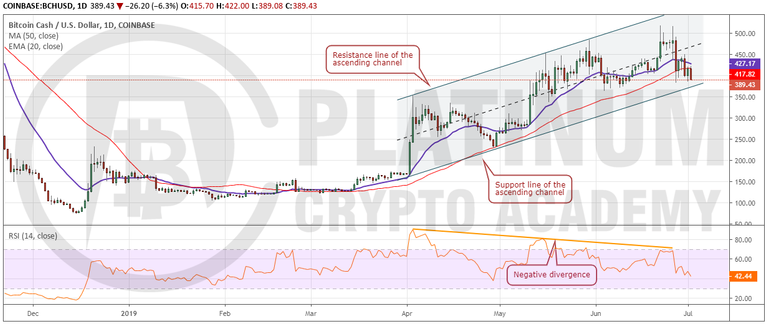
The bulls could not sustain the price above $500 on June 26. Bitcoin Cash turned down on June 27 and dived below both the moving averages. The bulls attempted to push the price back up but faced stiff resistance at the 20-day EMA.
Currently, the price has dropped close to the support line of the ascending channel. This is an important support. If the price rebounds off this level, it will keep the uptrend intact. The bulls will again try to scale above $450, which will indicate buying on dips. We might suggest long positions if the price stays inside the ascending channel.
On the other hand, if the bears sink the price below the support line of the channel, it will be a negative sign. Though the target objective is way lower, we anticipate some buying at $330 and below it at $270. The moving averages are on the verge of a bearish crossover and the RSI has dipped into the negative territory, which shows that the bears are in command.
LEARN HOW TO TRADE CRYPTOCURRENCY WITH A MASTER CRYPTO TRADER!
If you’ve booked your session above, we look forward to speaking to you soon!
Hopefully, you have enjoyed today’s article. Thanks for reading!
Have a fantastic day!
Live from the Platinum Crypto Trading Floor.
Hi! I am a robot. I just upvoted you! I found similar content that readers might be interested in:
https://www.platinumcryptoacademy.com/crypto-trading/weekly-review-of-top-cryptocurrencies-02-07-2019/