Hi Steemians,
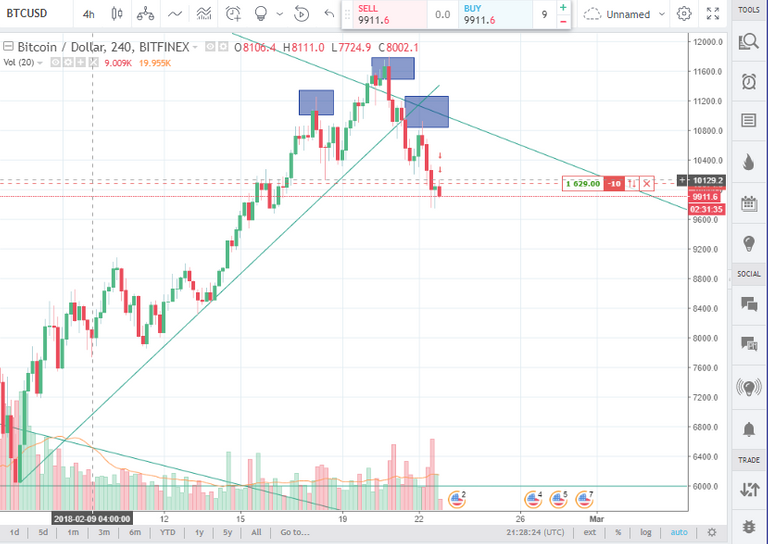
Bitcoin has dumped again after testing a break of the upper trend line. It couldn't hold over the trend line on a retest of support and now we have what is known as a BEARISH False Breakout.
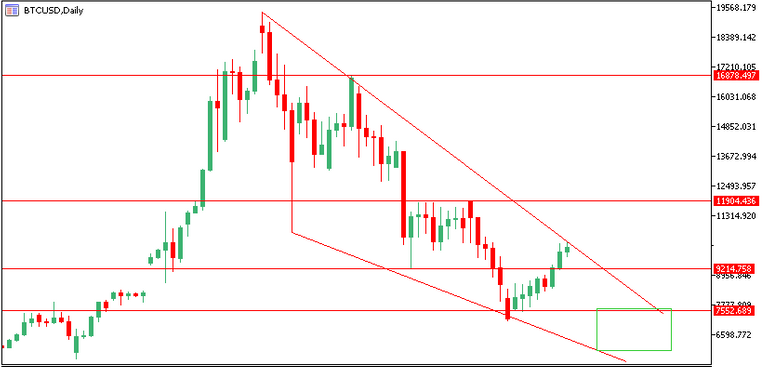
False breakouts are extremely explosive when they signal in the same direction of the current trend and this is concerning for those long, however, In my previous analysis on BTC I noted a buy zone down around $6600 and I still think that buy zone is viable.
We will be watching what bitcoin does when we come down to the level below, and when price comes down to retest lows. We could see a double bottom, or an A&E double bottom from here.
If you have been reading my articles on trading triangles, you can see, and i did note that this wedge break attempt is way too early for a break out, BTC needs one more test low before it will be ready for a successful breakout and we will be watching for this in the coming week, its just not ready yet.
FIG.1 - The green buy zone is still active. This buy zone sits just before the 75% mark of the wedge pattern. As we know from trading triangle rules, Triangle patterns break out between 75%-85% from beginning of the formation to the apex. That is why this break out was a false breakout, its too early for it to successfully break.


Nice straightforward analysis. I actually understood what you were talking about here. Some of the analysis out there is way to much and total overkill in my opinion.
Yeh it really is bud, its totally unnecessary and its dangerous! Keep an eye on a couple of my trade calls and you'll see how the simple patters I share clearly work. Not only that they're user friendly and easy to draw, read and trade!
We shorted BTC a couple of hours ago. Got a $500 profit on it currently and the first target is $9000 second target is $7500 :)_