LTCUSD
We have been watching LTCUSD as it trails along a historic trendline, looking for direction, our call was to go long at 55, and 60 and the price reached $70. If you were using stop losses, these gains should have been realized, and they were quite nice. The most important thing successful traders live by is the old adage, "nobody went broke taking profits." Stop losses do this for you, you have the ability to walk them up as price appreciates and they ensure you lock gains, limit losses and allow more flexibility, especially in capital preservation.
In crypto, stop losses are also known conditional orders.
So let's have another look.
Daily
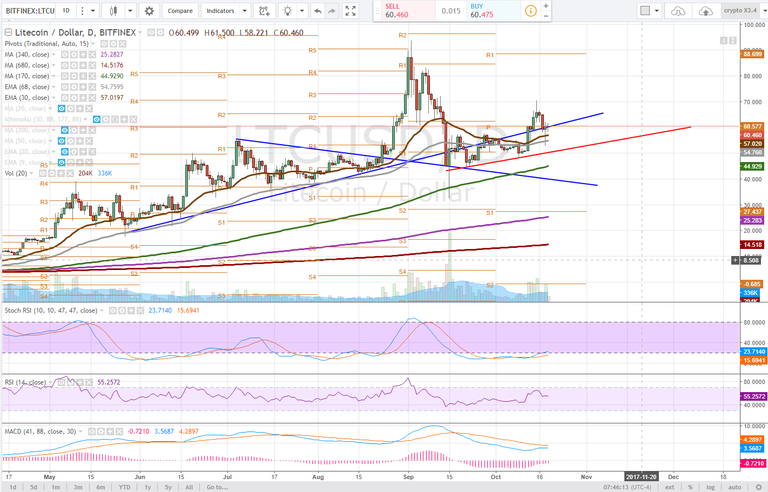
On the daily time frame, we have been watching LTC for a breakout above the historic trendline after backtesting its previous breakout. LTC did manage to get above the %60 trendline and push to $70 before it retraced back down.
Currently, the price is trapped between pivot resistance and the trendline. Looking at the Stochastic RSI and MACD we are looking for volume to drive momentum for a breakout as yesterday the price wicked off of the 68ema (grey line) only to push back to the pivot. This indicates that the bulls were there to buy that dip.
A trendline can be drawn on recent action illustrating a series of higher lows, as well, $70 would be a higher high. This trendline (red) is critical to hold. Price progression can begin if LTC breaks back above the daily pivot and confirms it and the historic trendline (blue) as support.

4 hour
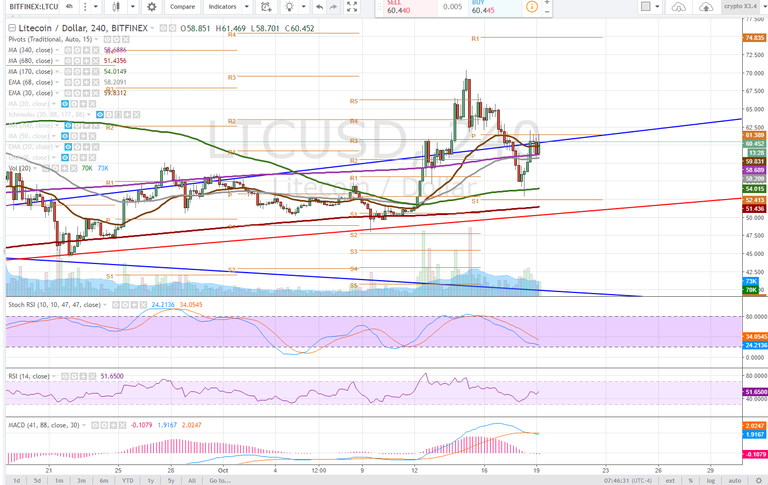
The 4 hour time frame doesn't look as great as with the stochastic RSI trending and a bearish MACD cross, though it is quite a weak bear cross.
Support has been found on that moving average convergence we were watching before with the price bouncing off of the 340dma 3 times. The pivot is proving to be a difficult resistance to crack. A 4 hour closing above trendline would be bullish and more bullish if above the pivot.
On this time frame, the series of higher lows and higher highs is very obvious and the goal here for bulls is to see this consolidation (which appears to be a bull flag) produce yet a higher high.

1 hour
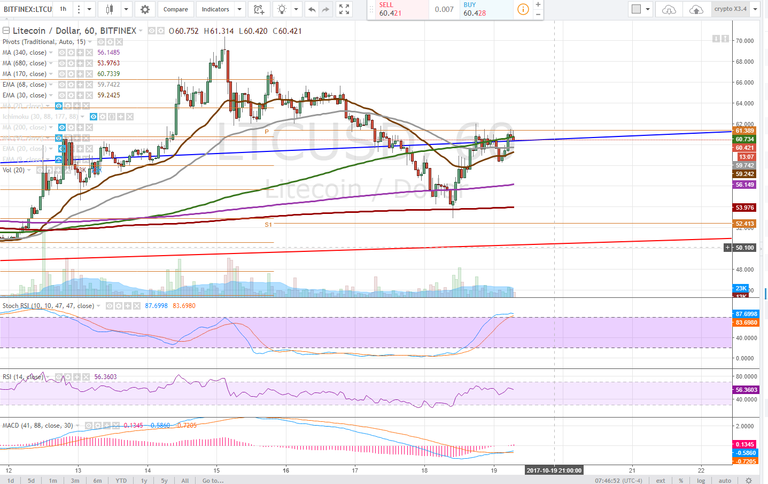
The 1 hour time frame is showing the 30ema curl towards the 68ema and a cross above would be bullish. The price is currently testing the trendline after failing to break above the 170dma. If the 170 DMA can be recaptured as support this would be extremely conducive to continued bullish momentum. However, this is a possible double top forming here on this time frame with 2 test of the pivot and wicking down as it is rejected.
The stochastic RSI has trended upwards and though it is curling currently there is plenty of time to reverse and maintain. A bullish MACD cross has occurred on this time frame though it is quite weak.

All in all, if LTC can reclaim that trendline convergence with the daily pivot, bulls will have taken back control. If not is imperative that the price maintains the red trendline on the daily chart.
Bullish Above: $62, very bullish if we keep setting higher highs
Bearish Below: $52.5, very bearish if the red trendline is breached
RISK TRADE: go long on a break above the pivot, R/R isn't here until price progression is proven. Sometimes its best to miss a penny to lock a dime.
Don't forget to use stop losses!!!
Previous Articles:
XMRUSD
ETHUSD
BTCUSD
DASHUSD
ZECUSD
BTCUSD
LTCUSD
Follow at your own risk, Not a financial adviser, understand the risks associated with trading and investing. Manage your own Risk - in other words you could lose it all and it's your own fault.

Interesting article about how to make money
Love that you cover many different times frames on the charts!
Where there is a will, there is a way. If there is a chance in a million that you can do something, anything, to keep what you want from ending, do it. Pry the door open or, if need be, wedge your foot in that door and keep it open.
thanks you so much for giving me for most useful info and technical analysis...
You are welcome, I hope these posts are educational as much as anything ;-)
do you think it will break the resistance and it likely to go to 65 by the weekend?
It can if it reclaims the 62s and negates the M top that has formed on the 1 hour time frame! Good luck!
good job, thank you.