Hey Everyone!!
[In my pervious guide] (https://steemit.com/education/@mannythetrader/why-is-the-trend-your-friend)
I went over what trend lines were. How to plot them, when to plot them, and how to profit from them. I discussed how the market moves in a series of zig-zags, essentially making higher highs, and lower lows. Here I will be introducing the support and resistance method of analysis. Let's dive right into this.
The reaction lows of a market are marked as support - the name exemplifies exactly that... A support level for the market, under the market. This area is where buy orders typically reside. Support levels are to be identified by a previous reaction low.
Resistance levels are precisely the opposite. They lie above the market, acting as a psychological level for sell orders to reside on. Resistance levels are ID'd by a previous high/peak. Below we will see an example of this.
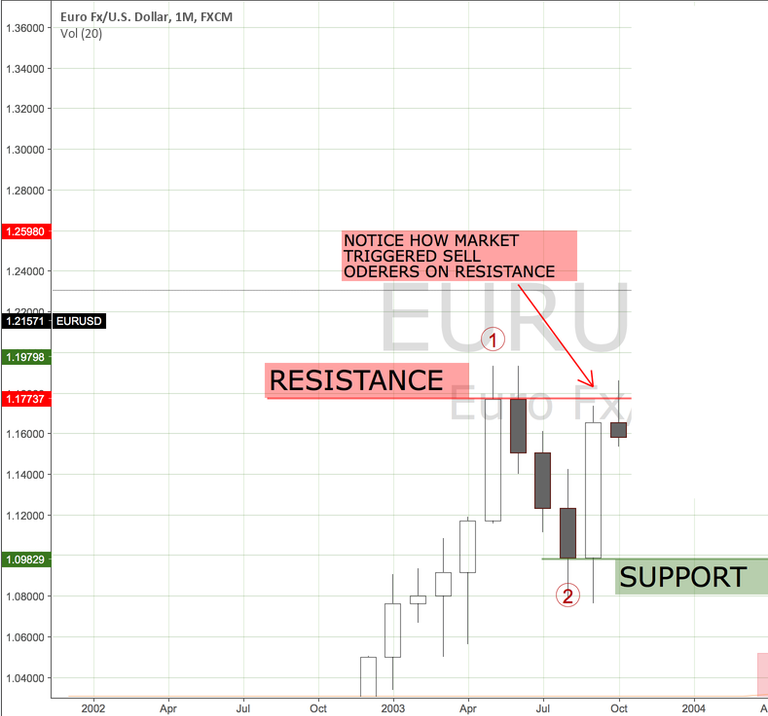
EURUSD Monthly | S&R Steemit Example (fig. 1)
--
Support and Resistance Levels Will Change Their Roles
Whenever support and resistance levels are disrespected by an aggressive movement, they essentially switch roles.
Resistance Becomes Support (In an uptrend)
Support Becomes Resistance (In a downtrend)
As illustrated below 👇🏻👇🏻👇🏻👇🏻
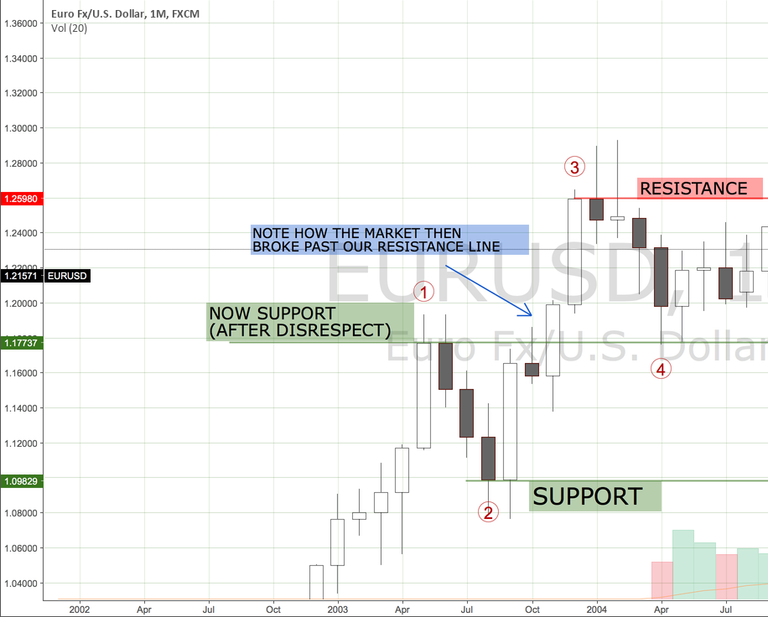
EURUSD Monthly | S&R Steemit Example (fig. 2)
It's important to understand that during bear markets, a past support level is typically not sufficient enough to halt the down trend permanently, but may be a good place to execute a long position within the market for a short term play, ultimately examining the markets for reversals and then identifying continual patterns play a key role here.
Additionally, if the market dips all the way down to its previous low, it may be an early warning sign that bulls are experiencing exhaustion - which can mean that a consolidation period is imminent. If the market breaks and closes below a support line during an uptrend then a reversal downwards is probable.
Below you'll see how the market moved higher (Wave 5)- then reversed back to it's previous low (Wave 4) signaling a consolidation period.
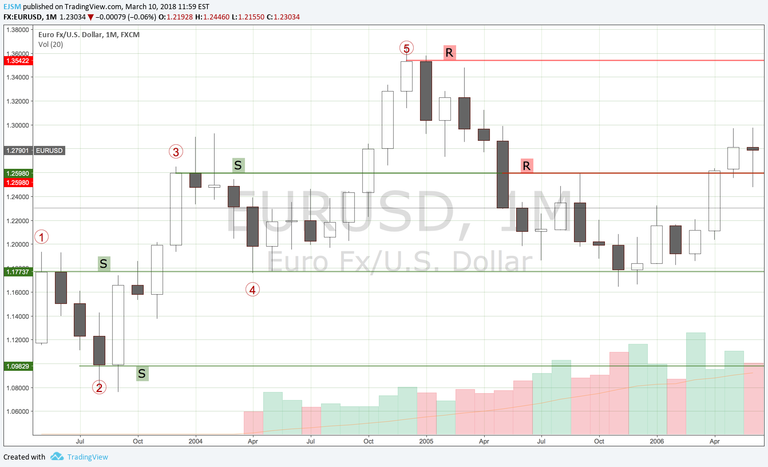
After reaching Wave 5 the market consolidated for 10 months before proceeding upwards again establishing its previous resistance as support.
Note: The red numbers indicate waves within the market which are heavily correlated to the Elliots Wave principle, I will be writing a guide on Elliots Wave Analysis pronto, I have no doubt that you're a smart person, as it would be wise to follow for more content like this!
Looney Tunes and Merrie Melodies - Warner Bros.
There are many more things I'd like to cover, such as the basic chart understanding -Japanese Candle Sticks - Price Action Patterns - Risk Management etc. Thanks for reading and remember to share! Adios ✌🏻
Find me on other social platforms -
IG: @MannyTheTrader
TradingView: @EJSM
Website: Stratcapita.com
Apple Podcast: The Cryptar Show
You should definitely do more of these!
I've been pretty successful in investing in general, but I'm just getting into technical analysis and trading, and I'd love to learn more. Of course, I already know these basic things, but if you could do some more in-depth stuff, I'd really appreciate it!
Great post :)!
Thanks bro, and I'm glad to hear that! Be sure to stick around - I'll be going over some nifty tools this week, also if you've got any requests, I'm more than open to them. 😁💯