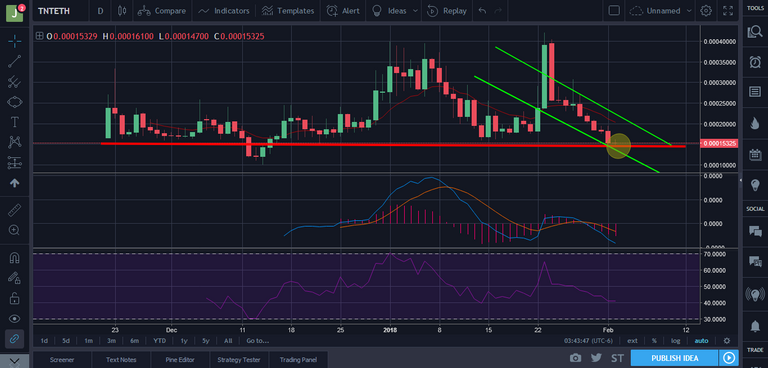
As you can see in the TNT daily chart that I have created, that it looks that a doji has formed at the bottom of the bearish trend on the support line and hopefully this next day can bring us some confirmation that the trend is breaking leading to a bullish run.
Also, our MACD and RSI indicators look great.
LET THE BULLS RUN!!!
I hope you enjoyed this analysis. Please show your support as I will continue to add more and I'm open to suggestions and question.
Happy trading and Hodling.
Congratulations @karpone! You have received a personal award!
Click on the badge to view your Board of Honor.
Do not miss the last post from @steemitboard:
SteemitBoard World Cup Contest - The results, the winners and the prizes
Congratulations @karpone! You received a personal award!
You can view your badges on your Steem Board and compare to others on the Steem Ranking
Vote for @Steemitboard as a witness to get one more award and increased upvotes!