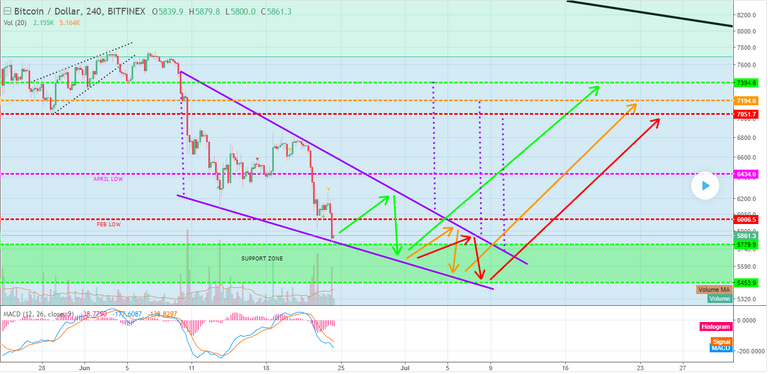
Ok, as per my last analysis I discussed the possibility of a falling wedge reversal pattern forming. We actually fell through the bottom of the previous falling wedge I drew, so I have now recalculated based on the updated price movements. I still believe the falling wedge reversal is the most likely scenario at play; and these latest movements actually indicate a larger pattern size and hence higher breakout scenarios to the upside when based on the height of the pattern.
As you can see we are now expected to go up to around 6200-6300 before retracing again. From there I have drawn three possible scenarios based on where and when we might break out of the falling wedge:
The green arrows launch us out of the bullish falling wedge after bouncing off the green support zone at around 5680.
The orange arrow scenario sees us fall deeper into the green support zone at around 5500ish.
Whereas the red arrows plays out even longer and takes us all the way to the bottom of the support zone at around 5450ish.
Regardless of which scenario plays out; we are still ultimately going lower, it’s just a matter of when! The good news is that once this happens we will then go higher as per the height of the pattern provided we have supporting volume (thus confirming our breakout).
Although our ideal paths are the green or orange arrows, at this point in time I am more biased towards the orange or red arrows; as these days we seem to play patterns out right to the apex rather than exiting at our optimal points. I still believe it won't be until October/November when we finally break out of the long term downtrend line (black). Once this happens we will go up before retracing to retest the same level as break out as support and then start the bull run. So yeah, I still feel that December seems right for the start of the actual bull run.

Very good points, easy to understand and clear. Plus, some optimism, finally! Thank you! I did hope you're right(other than a sooner bull run lol, it would be nice)