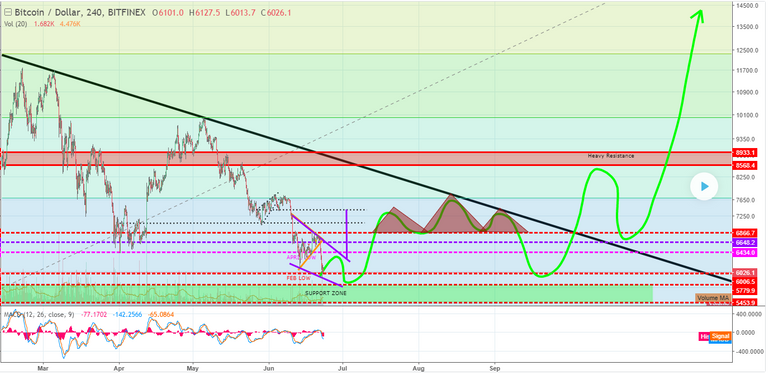
As per my last analysis – the symmetrical triangle pattern has played out. If we don’t go any lower, then we might be forming the purple falling wedge reversal pattern. This pattern sees us start to move higher (to around 6400ish – April low) before sinking us all the way to 5780ish where we have strong support. From here based on the height of the pattern, we would hope to see a break out take us back to around 7400 before retracing to 6800 for support. This forms the left shoulder of a head and shoulders pattern that will inevitably sink us back down to 6K before we finally break out to the upside of the large long term triangle pattern and start going into bull mode for the end of year run.
A lot of people will say this is a pretty farfetched prediction, as it is impossible to predict the market long term (let alone short term sometimes!). I tend to agree with them, however this is just a fun prediction based on the falling wedge reversal pattern playing out, utilizing the height of a confirmed break out and then the subsequent support and resistance levels. Let’s see how it goes, but don’t take this as gospel! I will complete a more detailed bitcoin analysis for the short term in the coming days, however at this point in time I am still seeing a possibly falling wedge reversal pattern forming, thought this might change depending on how the next 24 hours plays out.
