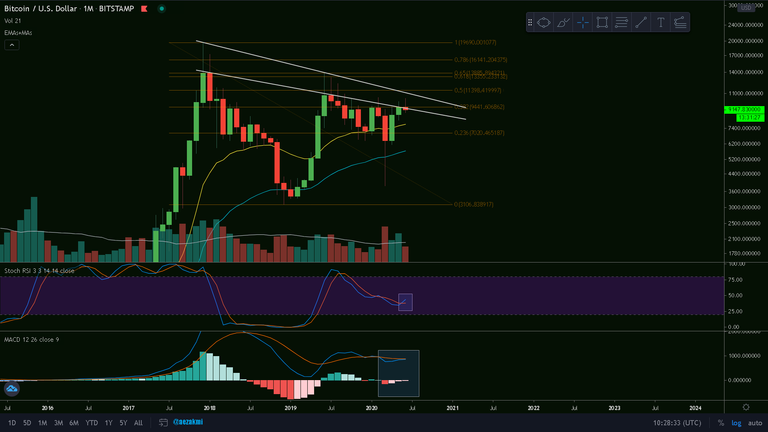
BTC/USD Monthly Chart
On the monthly, we're right at the lower trend line (the "candle-body" one) and it looks like we're going to close the June candle below the resistance. Despite the bullish cross on the Stoch RSI and the MACD approaching the signal line, the trading volume is much lower than the one in May. There is still some time left. Who knows? Maybe the bulls will push the price above $9440 and the 0.382 Fibonacci retracement level. Quite unlikely, but would be great news.
Ctrl + Click here to enlarge the image in a new tab (steemitimages)

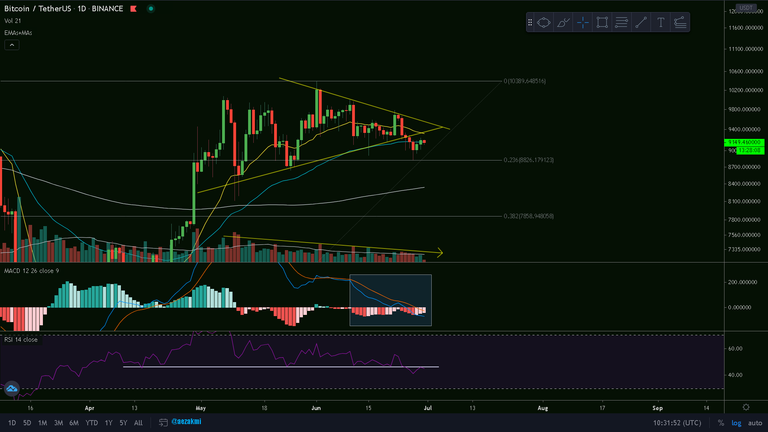
BTC/USD Daily Chart
On the daily we lost the triangle pattern I mentioned in the previous post, had a perfect touchdown at the 0.236 Fibonacci retracement and are fighting to regain the 55 EMA (blue). However, the volume is still declining, the MACD is entering the negative side, after having another rejection at the signal line and the RSI support level has turned into resistance.
The triangle however can be readjusted, so that we have three touchdowns at the lower line. I'll post the readjusted version in the comment section.
Ctrl + Click here to enlarge the image in a new tab (steemitimages)


Thanks for reading and safe trading!✌
If you find this post useful, please:
