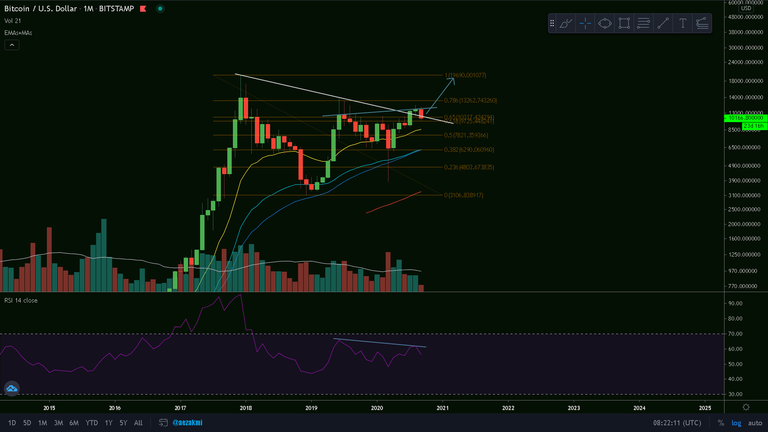
BTC/USD Monthly Chart
Since my last post Bitcoin was in a continuous sideways movement, without doing any major price changes. After getting a bearish divergence on the RSI, we're currently retesting the support back at the almost-3-year long descending trendline, which aligns with the 0.618 Fibonacci retracement. If this holds, we might see Bitcoin breaking the 0.786 ($13k) and heading towards the previous high by December 2020.
Ctrl + Click here to enlarge the image in a new tab (steemitimages)

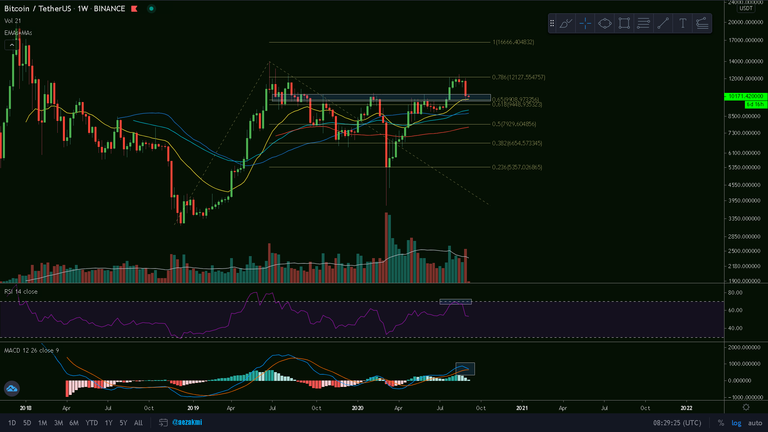
BTC/USD Weekly Chart
The weekly chart gives us a different perspective of the whole price action: we have Bitcoin reaching the 0.786 Fib. extension of the Dec. 2018 - Feb. 2020 movement, currently finding support near the golden pocket. This specific $9500-$10000 levels indicates a very strong support level; a lot of price action happened here in the past and the 21 EMA is here as well. As you can see, we got a rejection at the upper band of the RSI, but we have some sort of a bullish hidden divergence, higher low on the price and same low on the RSI.
If we're going to flip the 0.786 ($12k), we will probably see Bitcoin at the 1:1 extension ($16) in Q1 2021.
Ctrl + Click here to enlarge the image in a new tab (steemitimages)


Thanks for reading and safe trading!✌
If you find this post useful, please:

Congratulations @aezakmi! You have completed the following achievement on the Hive blockchain and have been rewarded with new badge(s) :
You can view your badges on your board and compare yourself to others in the Ranking
If you no longer want to receive notifications, reply to this comment with the word
STOPDo not miss the last post from @hivebuzz: