https://kr.tradingview.com/chart/BTCUSDT/R5KoRckB/
원본글입니다.

BITTREX:BTCUSDT -2.05% BINANCE:BTCUSDT -1.72%
비트는 언제 큰 상승을 할 수 있을까? 1편
https://kr.tradingview.com/chart/BTCUSDT/KJW1Dfbd/
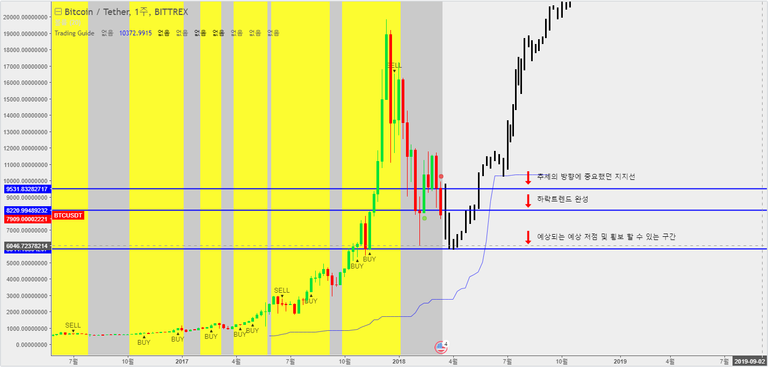
저번달에 1편에서 작성 했던 6천 횡보 가능성이 계속해서 커지고 있는 상황입니다
The article I wrote in last month indicated that the bitcoin price would be maintained with 6,000 usd level for months. And the current market situation is reinforcing the opinion more and more.
비트가 주봉상 이번주에 9500부근에서 싯가를 만들고 계속 하락중에 있습니다
The bitcoin hit the 9,500 USD level in this week but continuously decreasing and now it is heading to 8,000 USD already.
저번 글에서 9611에서 추가 하락 없이 시간적인 조정을 통해서 옆으로 횡보를 하는 그림이 나온다면 천천히 중장기적으로 괜찮은 추세를 만들수 있지만 9611 아래로 하락하여 8500정도 부근의 지지선이 깨진다면 다음달에 7천 아래 저점 횡보를 할 수 있다고 했는데 중요했던 지지선 2군데가 모두 가격방어에 실패하고 하락중에 있습니다
In the last article, I mentioned that the Bitcoin price would be getting increasing slowly if the 9,611 USD level was remained. On the other hand, I also told that the price would be decreasing to 7,000 USD level in case of the 2 support level (9,611 & 8,500 USD).
8220이 깨지면서 하락트랜드가 완성 되었고 12중순까지 얼리엇파동을 크게 5파까지 만들고 나서 지금의 하락추세는 정석대로 가고 있는 모습입니다
지속적인 하락추세로 인하여 중요한 지지선이 계속 바뀌고 있는데 지금의 가장 중요하고 강력한 지지선은 5900(6천 초반부근)이 가장 큰 지지선으로 볼 수 있습니다
Since the 8,220 USD Level is broken, the declining trend is operated with standard procedure and Elliott wave is reached to 5th grade in the middle of DEC, 2017.
5900(6천 초반부근)까지 가격하락이 될 가능성이 크고 5900(6천 초반부근)까지 하락을 한다면 다음의 상승을 위해서 시간적인 조정으로 저점횡보 하면서 개미털기 + 매집 구간을 만들 가능성이 크고 이후의 상승 추세의 시작은 4월 중순부터일 가능성이 큽니다
Because of the declining trend, Important support level is continuously changing but I can say that the most powerful & important support level will be 5,900 or early of 6,000 USD. The price is likely to fall to early 6000's and collecting section will be made for next up field if Bitcoin touch 5,900 USD level. If so, the upward trend might be started in the middle of April
4월 이후에 상승추세의 시작을 만들어서 5월 중순에 10000달러 정도를 만들어 주기만해도 사실 비트는 괜찮은 차트 입니다 반대로 최악의 상황은 다음달 다다음달에 6천부근의 지지라인에서 횡보후에 가격 상승 없이 5월말까지 10000달러를 만들지 못한다면 생각 이상의 매우 긴 하락기간을
만들 가능성이 큽니다
Bitcoin chart would be fine if the price is reached to 10,000 USD level until the middle of May. However, we can face the worst situation if the chart keep staying at 6,000’s support level for few more months and even can’t be reached to 10,000 USD at the end. If it is happened, we will face declining trend for a long term period.
하지만 여러가지 상황으로 고려 해봤을 때 추가하락 보다는 6천 초반 횡보이후에 4월 중순부터 상승추세를 만들어갈 가능성이 더욱 더 커보입니다
Hopefully, I would like to say that the upward trend will be made in the middle of April as I consider several signals.


매매 시그널이 뜨도록 보조지표를 만들고 있는데 테스트버전 무료 배포와 지표에 디테일을 더하기 위해서 수정중에서 있습니다
Now, I’m making a Secondary index which is indicating Buy & Sell signal and I will spread out test version for free once I add more details in it.
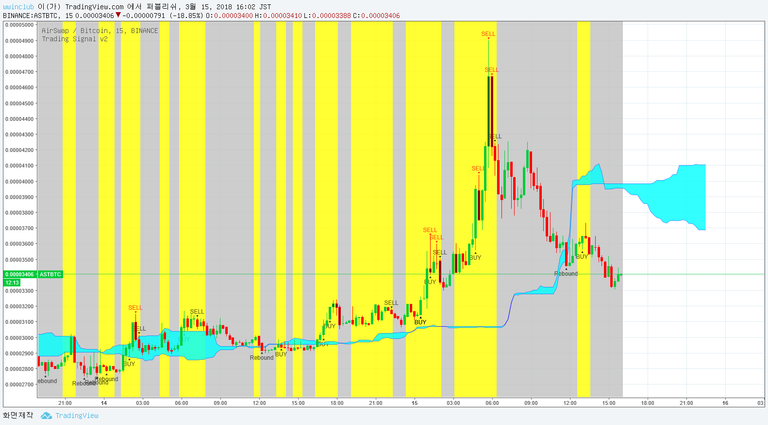
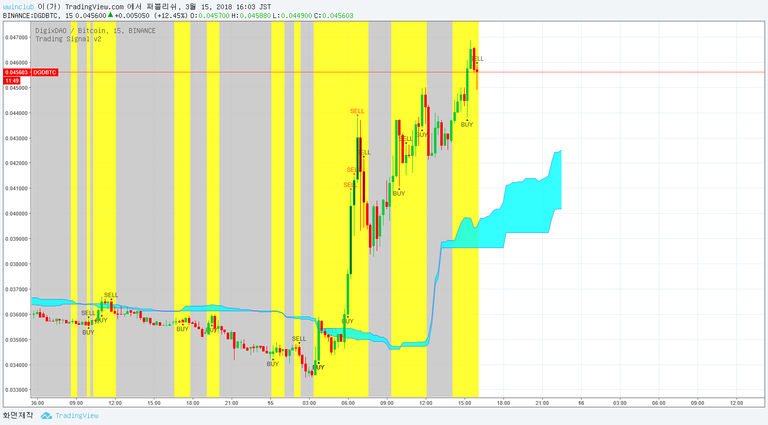
기본적인 매매 시그널은 구름대 위에 주가가 올라왔을 때 상승구간을 공략하는 매매법 입니다
구름대 위의 노란 배경에서 빨간색 REBOUND 반등시그널까지 매매하는 구간으로 잡으시면 됩니다
(첫번째 빨간색 REBOUND가 마지막 매수시점)
The basic trading signal is that exploits the rising section when the stock price rises above the cloud. The Buying section is from yellow background above the cloud to the red rebound signal. the final buying section is considered once the first rebound signal (red) is indicated.
테스트버전에 이용을 원하시는 분들은 댓글을 남겨주시면 되고 댓글을 남기실 수 없으신 분들은
https://open.kakao.com/o/giBCu4I
Please leave your comment if you want to use the test version.
Thanks.
위의 카톡방에 들어와서 # (한 칸 띄고) 트레이딩뷰 닉네임 적어주시면 됩니다