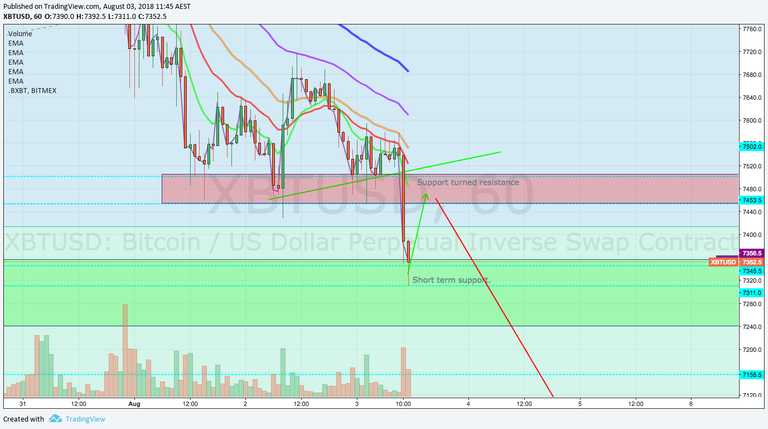
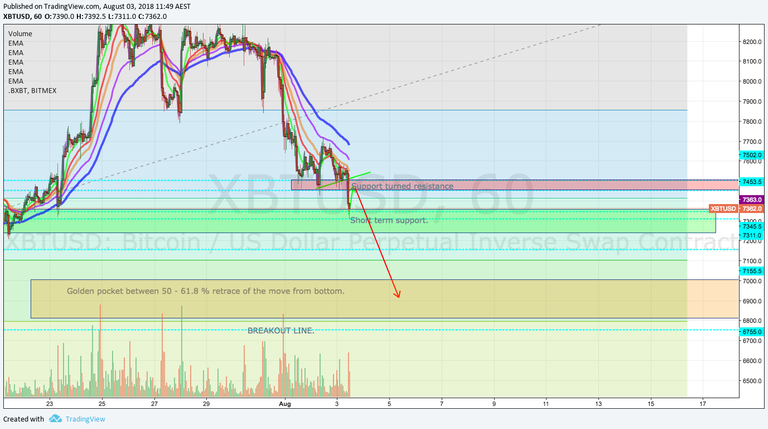
So we have hit the bounce zone of $7300.
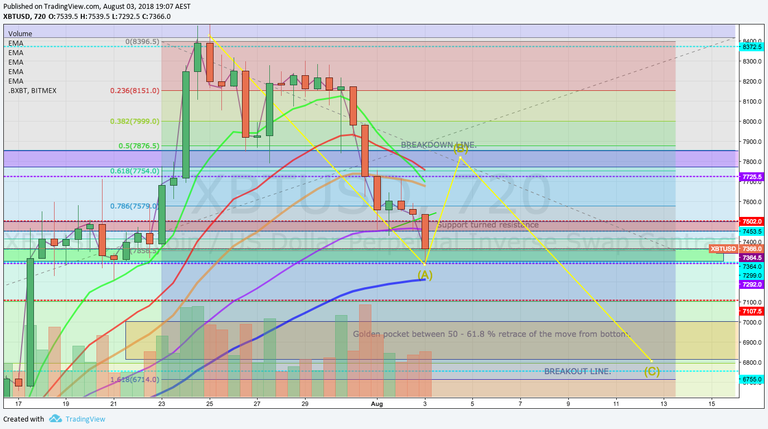
I think this could be a short term support level for a bounce back to test where we just broke down from before going back to test the breakout level, which line sup with a 50-61.8 % retrace and which would create a higher low on both the weekly and the 3 day and could be the end of wave 2 and the beginning of wave 3 (the big one)
Could the ETF news be the catalyst?
wave 3 could take up to 11 k and beyond.
https://www.tradingview.com/x/hs7Jpdya
https://www.tradingview.com/x/V3jBMQ78

I am watching this area for a bounce, lots of action and support around $7300.
One would expect at least a bounce from here but how high?
Possible back to the 50% fib level from that down move, which would line up nicely with where we broke down.
RSI on the larger time frames is getting oversold, so a bounce to reset the indicators would serve the bears well.
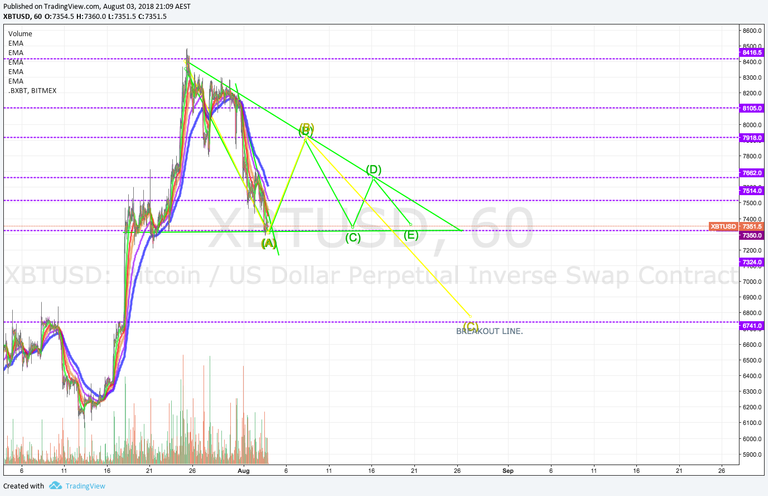
We could be inside a larger A,B,C correction down which a 1:1 measured move would land us right on the Breakout line and the 61.8% retrace from the entire move up.
https://www.tradingview.com/x/izYtc5Yg

This triangle could possibly play out over thE next few days before we Break out level and 61.8% fib.
