Price: ~ $10,800
24HR:
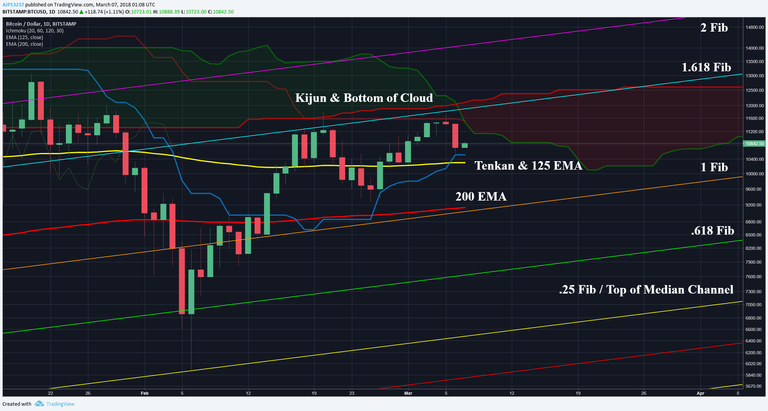
BTC was able to climb its way back to the Daily Kijun, however has begun to meet resistance in the $11K region again. Notice that the Daily Kijun is not the only resistance in that area, there’s also the entirety of the cloud & the 1.618 Fib, in other words a strong confluence of resistance between $11-11.5K.
A few subtle actions are beginning to take place with the Kijun & Tenkan. The Kijun is starting to turn down, indicating that the long term equilibrium between buyers & sellers in price is beginning to lower, aka strong resistance is lowering. The Tenkan is also starting to re-flatten, indicating that no new high’s or lows are being made in the short term & that BTC is likely entering a consolidation phase. Finally, signals to be watching in the coming days / weeks will be a bullish re-cross of the TK’s. A re-cross below the cloud will be the weakest signal, in the cloud neutral, and above strongest signal.

Currently price is getting caught by the Daily Tenkan & attempting to make its way back into the cloud. If price can successfully enter cloud, it will begin to be in a safe zone as long as it does not re-fall out of the cloud. However, if price struggles, the Tenkan will continue to offer support unless broken, in which stronger support is not until the 125 & 200 EMAs.
12HR:
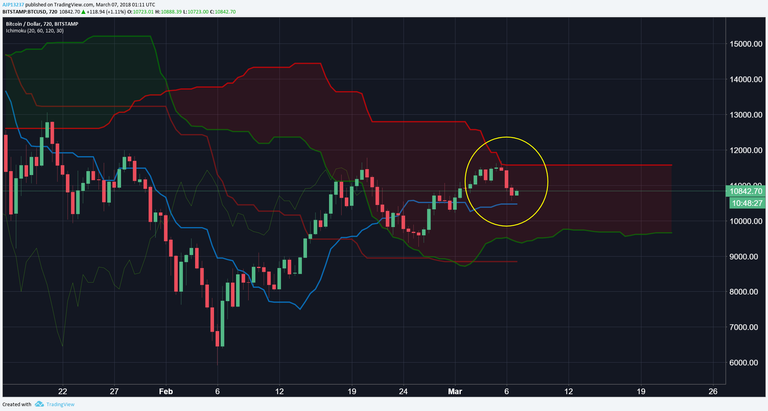
As pointed out in the previous update, the top of the 12HR cloud continues to prove tough resistance. This can especially be seen in the extended flattening of the cloud in the mid $11K region, indicating strong & extended resistance. Currently price is attempting to be caught on the Tenkan, however if the Tenkan support does not hold, an edge to edge move to the other side of the cloud is setting up. If completed, bottom of cloud support is just above & below $10K region.

6 HR:
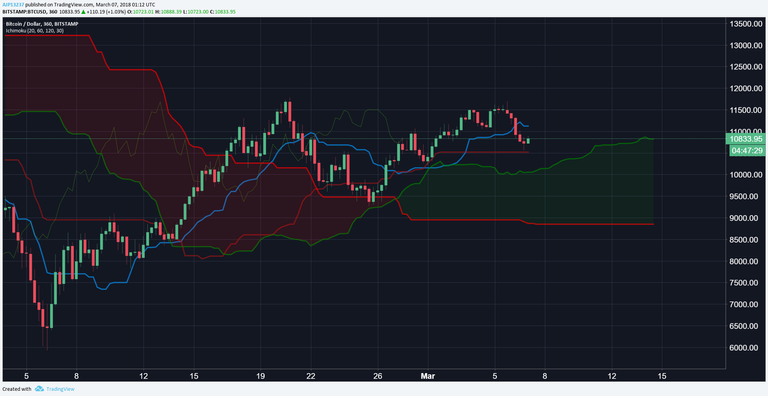
On the 6HR cloud, can see that price broke the Tenkan, but is finding a bounce on the Kijun. If bounce is successful, will need to re-break through broken Tenkan, otherwise run risk of rejection again. Finally, in the event that bears prove to be too strong, the 6HR has built thick support from $9K upwards & price has been tested-passed this area once, indicating that if price does falter, there is strong support in this region.

EMA Cross Follow-up:
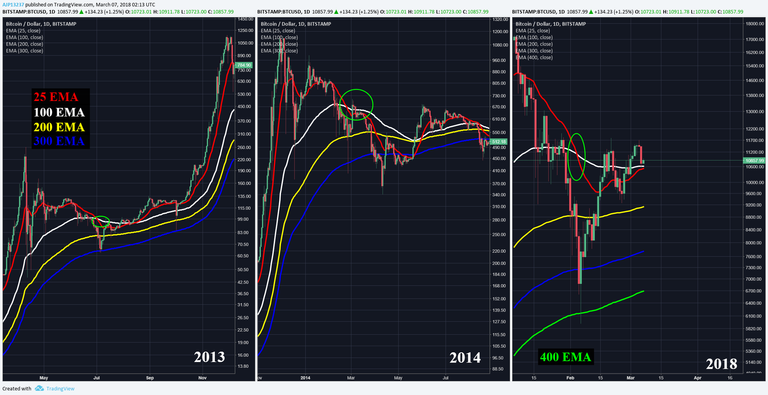
For those unfamiliar with the EMA follow-up section; BTC shares similarities with the 2013 & 2014 pullbacks in that they were large & drawn out enough to cross the 25 EMA (Fastest) & 100 EMA (Medium) and needed to find support around the 300 EMA. In 2013, there were no further crosses & once price and EMA’s properly re-crossed there was bull continuation. However, in 2014 the 25 EMA crossed with the other EMA’s and eventually price followed for bear continuation.

As of this moment, BTC is exhibiting more signs of 2013 than 2014, but still remains in a murky area; until a 25-100 EMA re-cross, the 2013 scenario will not be valid. Currently the 25 EMA remains stalled under the 100 EMA due to price not making higher highs, but are creating a confluence of support in this area. On today’s pullback, price is attempting to bounce on 25-100 EMA confluence. If this support holds, BTC is making a strong case for 2013 and likely gunning for a bigger move soon. In the event that support does not hold, the 200 EMA is also around $9K, a strong confluence of support region from previous indicators.
Prognosis:
BTC remains in an important spot being right under the daily cloud & on top of the EMA cross and may need to consolidate in this region for a few days. The longer BTC can hold this price region & fight off bears, the more likely BTC is to make a move for the daily cloud. In the event bulls are successful, strong resistance awaits bulls in $12-13K region. In the event that bears succeed, support begins in lower $10K’s, with the strongest around $9K.
If at any point you find these charts too small to read or want to zoom in, simply right click on the chart & open in new tab for full view.
If you found this useful & educational, please like, share, & follow.
steemit: @ dogevader
twitter: @ Noob_Charts
Finally, if you have any questions or comments, leave them below & happy trading!
good doge. Ty for analysis ur the best
Thanks for reading friend, glad you enjoy!
Thanks for the update man.. ;)
Great analysis. Thanks for sharing. I just added you to my bookmarks. I'll be adding your analysis links to my dailys in the steemit section.
Much appreciated friend :)