Price: ~$8,300
24HR:
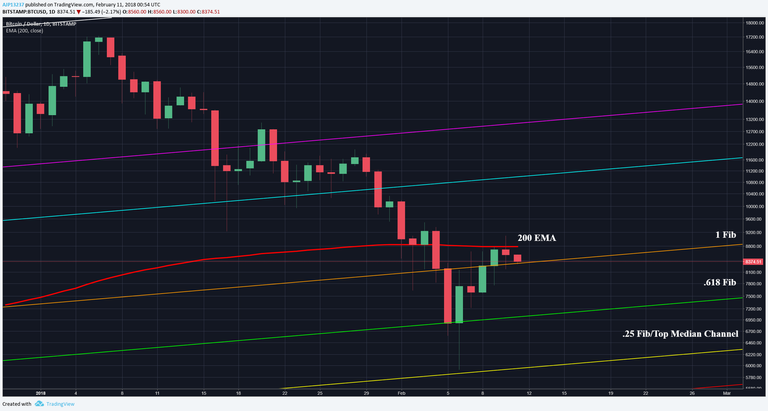
Since the last update, BTC was able to find support on the median channel before BTC wicked itself back up to the .618 fib & managed to close above it. Since then its’ been pinging around the 200 EMA & 1 fib with yesterday’s candle right in the thick of it. Given that the 200 EMA has been support the entirety of the Bull Run, it’s not surprising BTC is having trouble getting back over after breaking support. This will likely be a strong consolidation zone & heavy resistance until BTC is cleanly back above the 200 EMA. Finally, for now the 1 fib is support, but if this breaks, a trip back to .618 fib is on the table.
12HR:
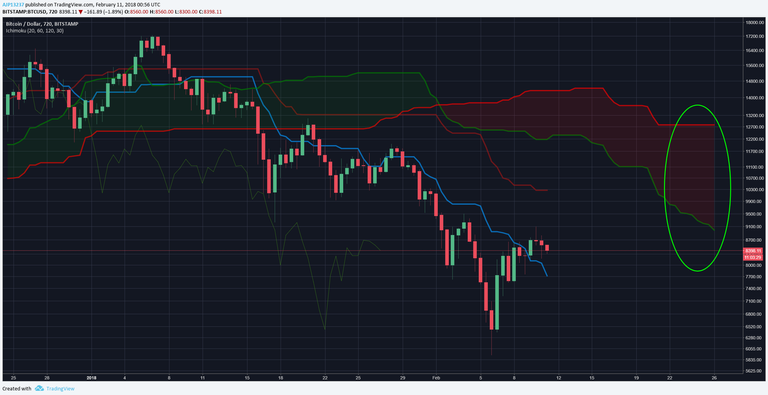
On the 12HR cloud, there is noticeable heavy cloud cover in the $9-12K range and while BTC is not there yet, this too will likely be a large consolidation zone once BTC manages to reach it. In the meantime, like the 200 EMA, this will be strong resistance in the short term.
6HR:
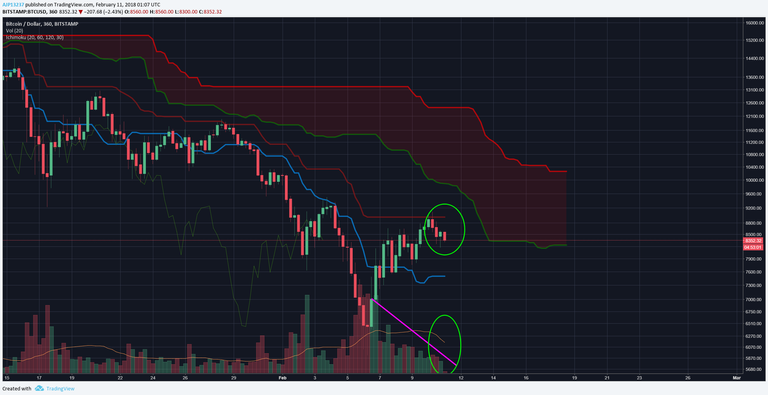
On the 6HR, price was able to rally its way to the Kijun before getting stopped. I’m on the lookout for a potential H&S setting up, left shoulder on the 8th, head yesterday, and right shoulder today. Characteristic of H&S is volume profile, if the right shoulder buy volume does not pick up & begins to outweigh by high red volume, the H&S will be in effect.
1HR:
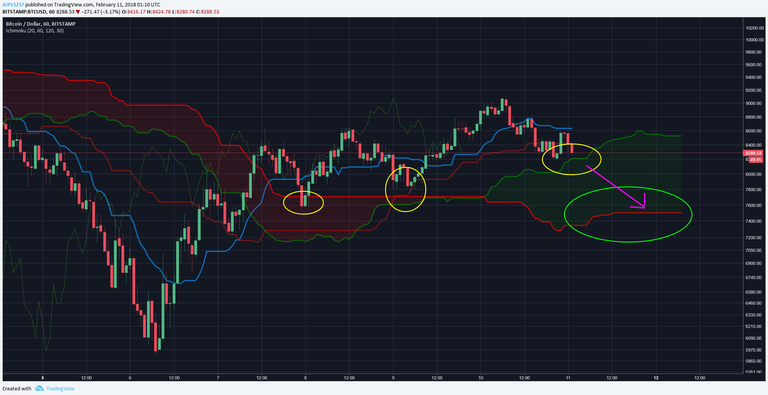
On the 1HR BTC has found support on the cloud the previous two trips circled in yellow and likely to tap on the cloud again. If cloud support holds, this will once again be a bounce zone. However, in the event BTC begins to traverse through cloud, be on the lookout for an edge to edge cloud move, outlined in green circle.
Weekly EMA:
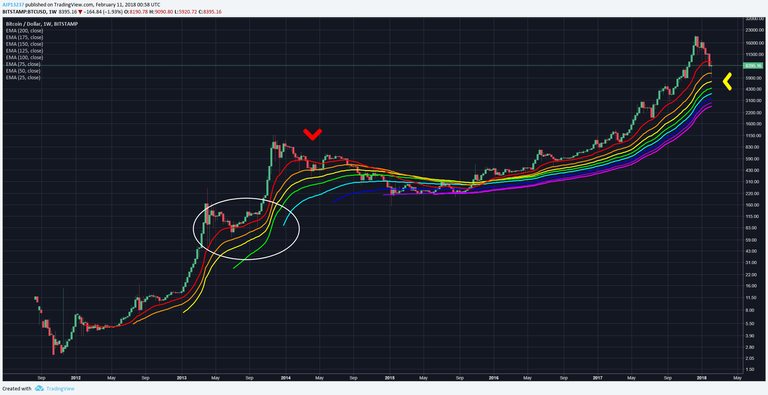
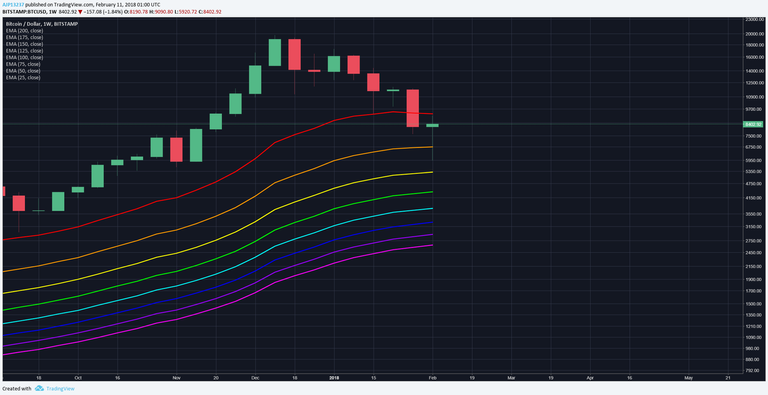
Another thing I’m going to be on the lookout in tomorrow’s weekly close & the following week is where price sits relative the the weekly EMA’s. At the moment, price is getting stopped by 25 weekly EMA, more clearly seen below. During the entire Bull Run, the 25 EMA only needed to be tapped on & was never broke.
Notice in the white circle, when 25 EMA broke, it was able to find support around the 50 EMA & make its next run up. However, in the red arrow area, when price wasn’t able to get back over the 25 EMA, it spelled out an extended bear market. Using EMA’s as a past reference will be guidance for how BTC reacts in the coming weeks.
Zoomed In:
Weekly Fibonacci Retracement:
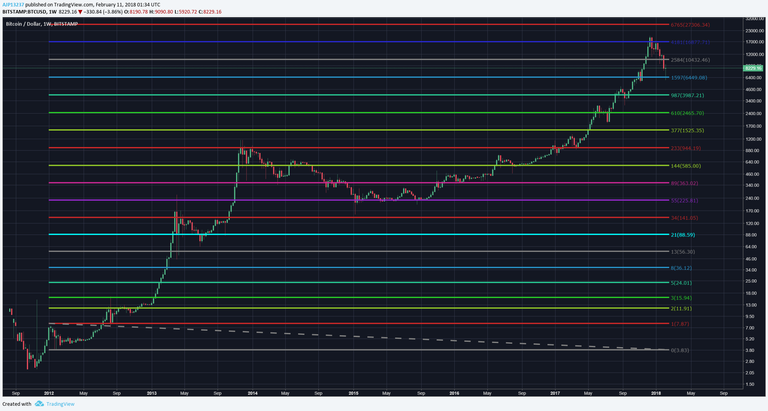
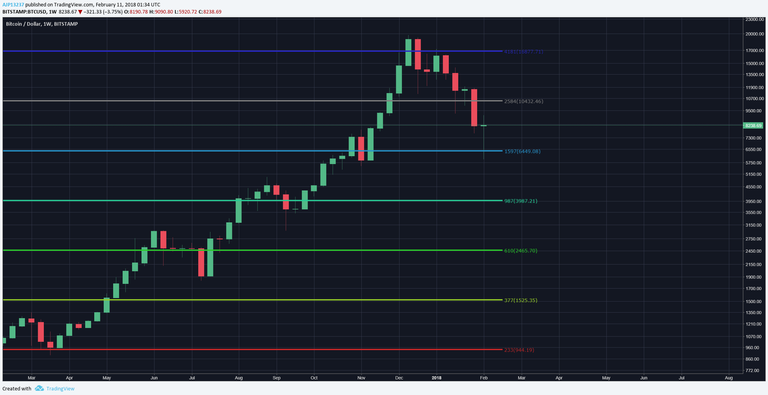
Finally, here is an updated Fibonacci retracement from the last update Since update BTC broke the 2584 fib and edge to edged to the other side of the fib, finding support around the 1597 fib. However, as alluded to before, BTC has not broken multiple fib supports during the Bull Run. The only other instances of breaking multiple fibs was during the 2013 & 2014 pullbacks, based on the fibs alone, it’s too be determined, which scenario BTC will follow.
Zoomed In:
Prognosis:
After breaking the 200 EMA earlier this week, BTC took a tumble down to $6K, providing a strong bounce back to the 200 EMA. Because the 200 EMA was strong support for so long, it will continue to provide resistance. This will be the first necessary recapture before for the bulls can begin charging again. If the $6K bounce proves to be real, BTC has room to run to $10-12K region before encountering the next hard & extended resistance area. If bounce is not strong enough, retesting in $7K’s looks like a strong possibility.
If you found this useful & educational, please like, share, & follow.
steemit: @ dogevader
twitter: @ Noob_Charts
Finally, if you have any questions or comments, leave them below & happy trading!
I use to trade the forex years ago but had to give it up. I do see price action moving sideways for the next week or so. As with everyone here, I'm praying that BTC goes up.
100% agree, too many supports were broken & need rebuilding before substantial up movement can be had. Thank you for your insight!